
support and resistance
Gösterge
13 satın almalar
Sürüm 1.0, Jun 2025
Windows, Mac
4.3
Değerlendirmeler: 3
Açıklama
Ana Özellikler:
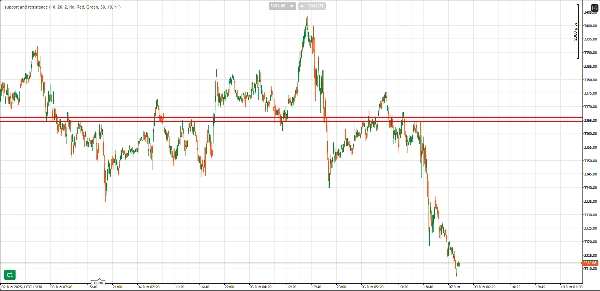
- Destek ve Direnç Otomatik Tespiti: Gösterge, fiyat hareketlerine dayanarak önemli destek ve direnç seviyelerini otomatik olarak belirler ve fiyatın defalarca ters döndüğü veya durakladığı bu bölgeleri vurgular.
- Sıçrama Sayısı Doğrulaması: Destek ve direnç seviyeleri, seviyeden gerçekleşen sıçrama (fiyat tepkisi) sayısına göre doğrulanır. Sıçrama sayısı arttıkça seviye daha güçlü olur. Bir seviyenin geçerli sayılması için minimum sıçrama sayısını ayarlayabilir, böylece yalnızca çok önemli seviyelerin işaretlenmesini sağlayabilirsiniz.
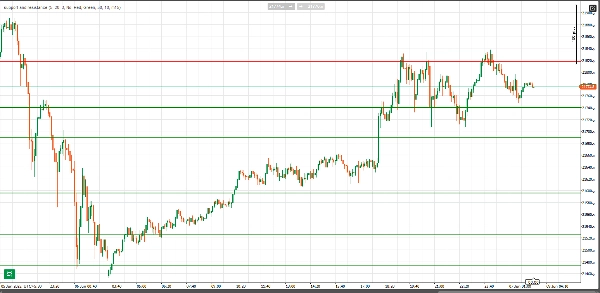
- Ayarlanabilir Çizgi Stilleri: Destek ve direnç çizgilerinin kalınlığı ve stili, sıçrama sayısına göre otomatik olarak ayarlanır. Daha fazla sıçramaya sahip seviyeler, daha kalın ve belirgin çizgilerle çizilerek önemleri görsel olarak vurgulanır.
- Bölge Genişliği (Pip): Destek ve direnç seviyelerinin etrafında pip cinsinden bir tampon bölgesi tanımlayabilirsiniz. Bu, fiyatın potansiyel olarak ters dönebileceği veya tepki verebileceği bir aralık içindeki fiyat hareketlerini belirlemede yardımcı olur.
- Daha Yüksek Zaman Dilimi Filtresi: Bu göstergenin benzersiz özelliklerinden biri, destek ve direnç seviyelerini daha yüksek zaman dilimi filtresi kullanarak doğrulayabilmesidir. Daha yüksek bir zaman dilimi seçerek (örneğin, 1H, 4H), gösterge belirlenen seviyeleri daha yüksek zaman dilimindeki önemli fiyat hareketleriyle karşılaştırır ve yalnızca önemli seviyelerin grafikte çizilmesini sağlar.
- Uyarılar: Fiyat bir destek veya direnç seviyesinin bölgesine girdiğinde, gösterge sizi sesli bir uyarı ile bilgilendirerek önemli bir fiyat tepkisini asla kaçırmamanızı sağlar.
- Özelleştirilebilir Renkler: Destek ve direnç çizgilerinin rengini tercihinize göre veya işlem temanızla uyumlu olacak şekilde kolayca değiştirebilirsiniz.
- Çakışma Önleme: Gösterge, çok yakın olan destek ve direnç seviyelerinin üst üste çizilmesini önleyen bir eşik filtresi içerir ve böylece yalnızca benzersiz ve önemli seviyelerin görüntülenmesini sağlar.
Faydalar:
- Zaman Kazanın: Ana destek ve direnç seviyelerini manuel çizim yapmadan otomatik olarak tespit edin ve görselleştirin.
- Net Görseller: Fiyat sıçramalarına ve daha yüksek zaman dilimi doğrulamasına dayalı olarak en önemli destek ve direnç seviyelerini kolayca görün.
- Etkili Uyarılar: Fiyat hareketi önemli seviyelere girdiğinde zamanında uyarılar alın, böylece hızlı ve etkili şekilde hareket edebilirsiniz.
- Gelişmiş İşlem Kararları: Bu göstergeden, giriş ve çıkışlarınızda ve genel teknik analizinizde daha fazla güven kazanmak için yararlanın.
Özelleştirme Seçenekleri:
- Geriye Dönük Çubuklar: Göstergeyi potansiyel destek ve direnç seviyelerini belirlemek için ne kadar geriye bakacağını ayarlayın.
- Minimum Sıçrama Sayısı: Bir seviyenin geçerli sayılması için gereken minimum sıçrama sayısını belirleyin.
- Daha Yüksek Zaman Dilimi: Destek ve direnç seviyelerini daha yüksek bir zaman dilimine (örneğin, 1 saatlik, 4 saatlik grafikler) göre filtreleyin.
- Çizgi Rengi: Direnç ve destek çizgileri için grafik stilinize uygun renkler seçin.
- Uyarı Ayarları: Fiyat destek veya direnç bölgelerine girdiğinde uyarıları etkinleştirin veya devre dışı bırakın.
Özet
YZ özeti
This indicator automatically detects key support and resistance levels by analyzing price action and identifying zones where price has reversed or stalled multiple times. It validates these levels based on the number of price bounces, allowing users to set a minimum bounce count to highlight only significant levels. The indicator visually emphasizes stronger levels by adjusting line thickness and style according to bounce count. Users can define a buffer zone around levels in pips to capture price reactions within a range.
A higher timeframe filter cross-checks identified levels against price action on selected higher timeframes (e.g., 1-hour, 4-hour), ensuring only important levels are displayed. Alerts notify users with audio signals when price enters support or resistance zones. The indicator prevents overlapping lines by applying a threshold filter, maintaining clarity on the chart. Colors of support and resistance lines are customizable to fit user preferences.
Customization options include adjusting lookback bars, minimum bounces, higher timeframe selection, line colors, and alert settings. This tool supports markets such as Forex, commodities, indices, and popular symbols including BTCUSD, EURUSD, GBPUSD, XAUUSD, NAS100, and USDJPY. It aids traders in saving time, improving visual clarity, receiving timely alerts, and making more confident trading decisions.
Gösterge profili
Gösterge kategorisi
Destek ve direnç
Çıktı türü
Görselleştirme
Veri gereklilikleri
Yalnızca çubuklar
Desteklenen sinyaller
Kırılma
Yön değiştirme
Müşteri değerlendirmeleri
4.3
Değerlendirmeler: 3
5 | 33 % | |
4 | 67 % | |
3 | 0 % | |
2 | 0 % | |
1 | 0 % |
Müşteri değerlendirmeleri
June 11, 2025
Nice setup companion for a more controlled workflow. It helps with planning entries and exits around important areas, but not every zone holds, even if it looks clean. The cleanest use is 3 to 5 levels per chart, with 0.5 pullbacks checked before entry. I would still keep manual review in the process.
June 10, 2025
June 10, 2025
Decent option for checks around key price zones. The useful part is planning entries and exits around important areas, with the numbers checked before scaling. I would wait for 2 reactions and avoid trades where the target is less than 1.5R. Levels are useful when they reduce noise, not when they crowd the chart.
Tartışma
SSS
BTCUSD
Prop
Forex
Breakout
Indices
EURUSD
Commodities
GBPUSD
NZDUSD
XAUUSD
NAS100
USDJPY
cTrader Store üzerinden erişilebilen işlem botları, göstergeler ve eklentiler gibi ürünler, üçüncü taraf sağlayıcılar tarafından sağlanır ve yalnızca bilgilendirme ve teknik erişim amaçlarıyla sunulur. cTrader Store bir broker değildir ve yatırım tavsiyesi, kişisel öneriler vermez veya gelecekteki performansı garanti etmez.


Fiyat
Başlangıç 30/05/2025
40
Satışlar