
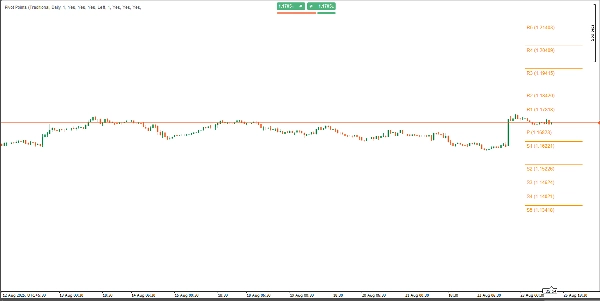
Pivot Point Daily Indicator
Gösterge
14 satın almalar
Sürüm 2.0, May 2026
Windows, Mac
4.2
Değerlendirmeler: 4
Açıklama
Ana Özellikler:
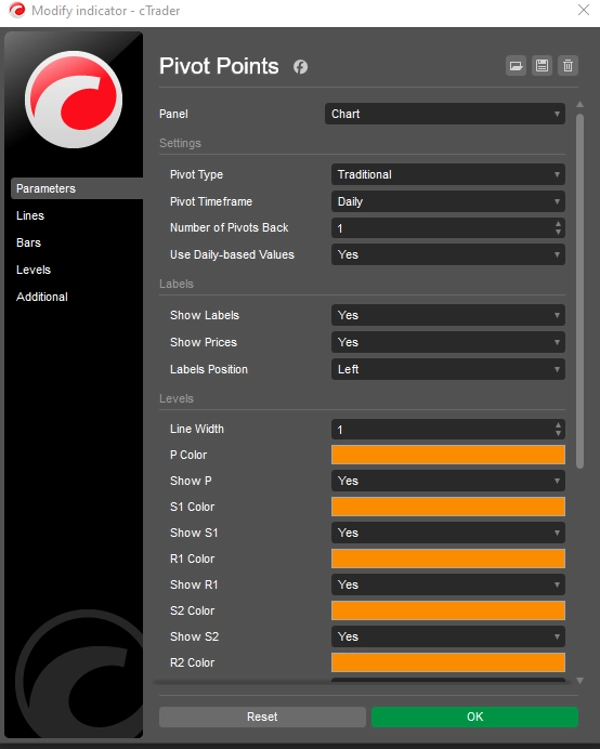
- Çoklu Pivot Stilleri: Altı pivot hesaplama yöntemi arasında sorunsuz geçiş yapın: Klasik, Fibonacci, Woodie, Camarilla, DM ve Geleneksel. Her yöntem farklı seviyeleri destekler (Geleneksel ve Camarilla için R5/S5'e kadar, Fibonacci için R3/S3 ve DM için P/R1/S1).
- Esnek Zaman Dilimleri: Otomatik, Günlük, Haftalık, Aylık, Çeyreklik, Yıllık ve çok yıllı seçenekler (İki Yıllık, Üç Yıllık, Beş Yıllık, On Yıllık) dahil olmak üzere geniş bir pivot zaman dilimi yelpazesinden seçim yapın. Ticaret ufkunuzla uyum sağlamak için mükemmeldir.
- Geçmiş Pivot Kontrolü: Gösterilecek geçmiş pivot setlerinin sayısını (1–200) Number of Pivots Back parametresi ile ayarlayın, böylece önemli geçmiş seviyeleri korurken grafik karışıklığını önleyin.
- Özelleştirilebilir Görünüm: Tamamen ayarlanabilir renkler, çizgi kalınlıkları ve etiket ayarları. Etiketleri ve fiyat değerlerini açıp kapatın ve netlik için etiket pozisyonlarını (Sol veya Sağ) akıllı dikey kaydırmalarla seçin.
- Günlük veya Gün İçi Veri: Farklı ticaret stratejileri için esneklik sağlayan günlük tabanlı değerleri veya grafik zaman dilimi verilerini kullanma seçeneği.
- Optimize Edilmiş Performans: Hafif, yerel cTrader kodu, gecikme olmadan hızlı, gerçek zamanlı güncellemeler sağlar; Forex, endeksler, emtialar, kripto ve daha fazlasıyla uyumludur.
Neden Pivot Points Standard'ı Seçmelisiniz?
- Çok Yönlü Ticaret Aracı: Herhangi bir piyasa veya zaman diliminde önemli destek/direnç seviyelerini, trend yönlerini ve kırılma fırsatlarını belirleyin.
- Kullanıcı Dostu Arayüz: Pivot türü, zaman dilimi ve etiket pozisyonu için sezgisel açılır menülerle özelleştirme çok kolay.
- Tarihsel Analiz: Geçmiş fiyat etkileşimlerini incelemek ve stratejinizi geliştirmek için 200'e kadar geçmiş pivot setini görselleştirin.
- Temiz Grafikleme: Akıllı etiket konumlandırma ve özelleştirilebilir çizgi uzunlukları grafik karışıklığını önler, okunabilirliği artırır.
Nasıl Kullanılır:
- Göstergiyi cTrader grafiğinize uygulayın.
- Tercih ettiğiniz Pivot Türünü (örneğin, Fibonacci, Camarilla) ve Pivot Zaman Dilimini (örneğin, Günlük, Aylık) seçin.
- Gösterilen geçmiş setleri kontrol etmek için Number of Pivots Back değerini ayarlayın.
- Renkleri, çizgi kalınlıklarını ve etiket ayarlarını tarzınıza göre özelleştirin.
- Pivot seviyelerini destek/direnç belirlemek, stop-loss/take-profit ayarlamak veya kırılmaları ticaret yapmak için kullanın.
İdeal Kullanım Alanları:
- Günlük Tüccarlar: Günlük veya Haftalık pivotları kullanarak gün içi giriş ve çıkışlar yapın.
- Swing Tüccarları: Daha uzun vadeli trendleri yakalamak için Aylık veya Çeyreklik pivotları kullanın.
- Scalperlar: Hızlı ve hassas işlemler için daha düşük zaman dilimleriyle birleştirin.
- Tüm Piyasalar: Forex, hisse senetleri, kripto ve emtialar arasında sorunsuz çalışır.
Ticaret Güveninizi Artırın
Pivot Points Standard ile teknik analizi basitleştiren ve yüksek olasılıklı ticaret fırsatlarını fark etme yeteneğinizi artıran güçlü, hepsi bir arada bir araca erişim sağlarsınız. İster yeni başlayan ister deneyimli bir tüccar olun, bu gösterge stratejinize uyum sağlar ve ticaret becerilerinizi yükseltmek için net, uygulanabilir seviyeler sunar. Bugün Pivot Points Standard'ı deneyin ve ticaretinizi hassasiyet ve netlikle kontrol altına alın! Tek seferlik ödeme. Ömür boyu erişim. Gelecekteki güncellemeler dahil.
Özet
YZ özeti
Pivot Point Daily Indicator is a multi-timeframe pivot point tool designed for the cTrader platform. It supports six pivot calculation methods—Classic, Fibonacci, Woodie, Camarilla, DM, and Traditional—each offering various resistance and support levels (up to R5/S5 for some methods). Users can select from a broad range of timeframes including Auto, Daily, Weekly, Monthly, Quarterly, Yearly, and multi-year intervals, allowing alignment with different trading horizons.
The indicator allows displaying up to 200 historical pivot sets to analyze past price interactions while maintaining chart clarity through customizable label positions and line settings. It offers options to use daily-based or intraday data, enhancing flexibility for diverse trading strategies.
Pivot Point Daily Indicator is optimized for real-time performance with native cTrader coding, compatible across Forex, indices, commodities, cryptocurrencies, and other markets. Its interface includes intuitive dropdown menus for pivot type, timeframe, and label customization.
Traders can use this indicator to identify key support and resistance levels, trend directions, and breakout opportunities, aiding in setting stop-loss and take-profit points. It suits various trading styles including day trading, swing trading, and scalping across multiple asset classes.
Gösterge profili
Gösterge kategorisi
Destek ve direnç
Çıktı türü
Filtre
Veri gereklilikleri
Yalnızca çubuklar
Desteklenen sinyaller
Seviye kırılması
Müşteri değerlendirmeleri
4.2
Değerlendirmeler: 4
5 | 25 % | |
4 | 75 % | |
3 | 0 % | |
2 | 0 % | |
1 | 0 % |
Müşteri değerlendirmeleri
May 2, 2026
Bought it, added it, used it for a while, and now it's disappeared, and I cannot get it back!
August 28, 2025
Good helper for review if the trader wants it keeps attention on levels that actually matter. It works best as support, not a final decision maker. The cleanest use is 3 to 5 levels per chart, with 0.5 pullbacks checked before entry. not every zone holds, even if it looks clean.
August 27, 2025
August 27, 2025
Usable tool with purpose for traders who build plans around market levels. It gives value around key price zones, but not every zone holds, even if it looks clean. I would wait for 2 reactions and avoid trades where the target is less than 1.5R. Levels are useful when they reduce noise, not when they crowd the chart.
Tartışma
SSS
Fibonacci
Prop
Forex
Breakout
Indices
Commodities
cTrader Store üzerinden erişilebilen işlem botları, göstergeler ve eklentiler gibi ürünler, üçüncü taraf sağlayıcılar tarafından sağlanır ve yalnızca bilgilendirme ve teknik erişim amaçlarıyla sunulur. cTrader Store bir broker değildir ve yatırım tavsiyesi, kişisel öneriler vermez veya gelecekteki performansı garanti etmez.


Fiyat
Başlangıç 30/05/2025
40
Satışlar