
Açıklama
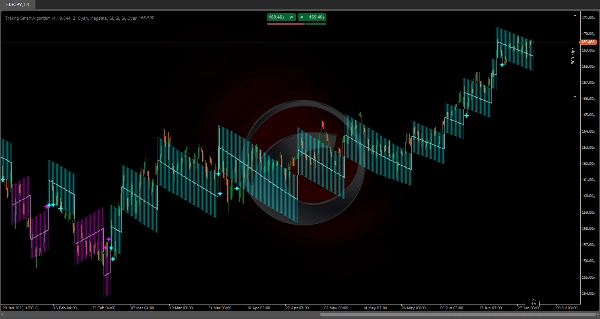
Takip Eden Akıllı Algoritma
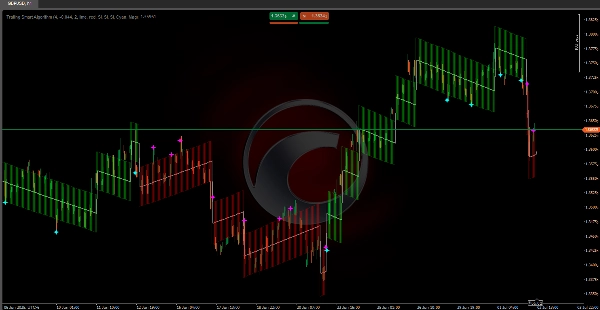
https://chartshots.spotware.com/c/69f0f1d89000b
Özellikle matematiksel algoritmaları 🧠 herhangi bir piyasa koşulunda fiyatı tutarlı bir şekilde takip etmek için tasarlanmıştır. 🌐.
Hesaplama yapısı, trend çizgisinin her zaman fiyat hareketleriyle senkronize kalmasını sağlar ve geleneksel göstergelerin tipik gecikmesini önler ⏳.
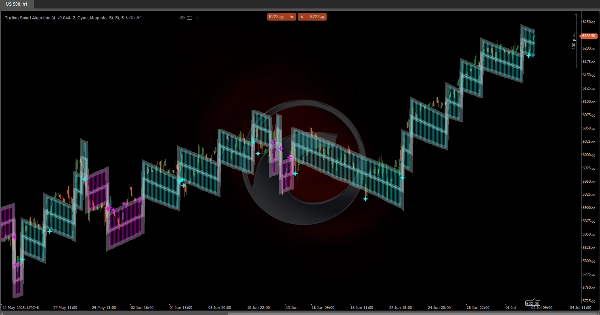
Geleneksel algoritmaların aksine, bu sistem kesin volatilite ölçümleri 📊 kullanır ve otomatik ayarlamalar ⚙️ uygular, bu da optimal takibi garanti eder. İç hesaplamaları, hem hızlı hareketler ⚡ hem de kademeli trend gelişimi 🕊️ sırasında piyasa yönünün doğru bir temsilini sunacak şekilde tasarlanmıştır.
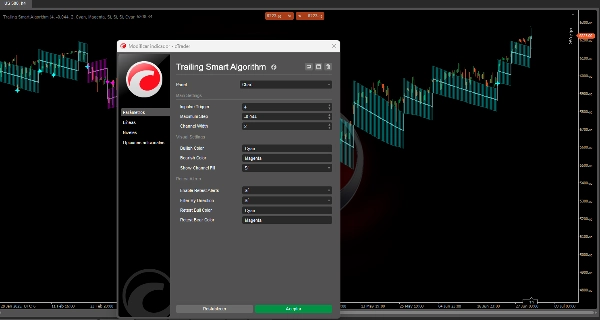
https://chartshots.spotware.com/c/69f0f218591b0
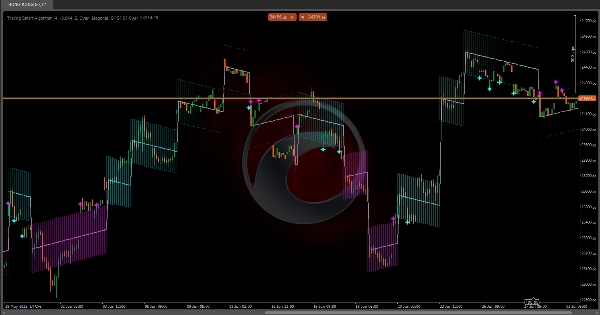
💡 Nasıl Çalışır?
Gösterge, baskın trend yönünde hareket eden uyarlanabilir adım sistemi kullanır.
Üç ana bileşene dayanır:
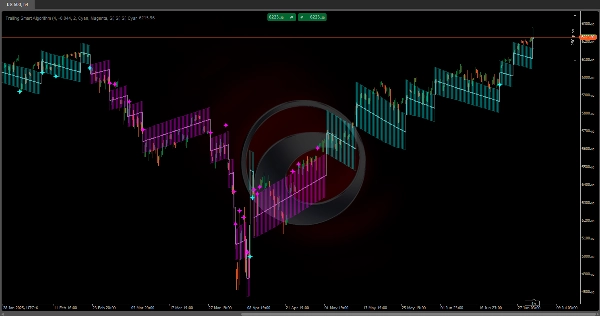
https://chartshots.spotware.com/c/69f0f2b19e4d3
1️⃣ Trend Değişikliği Tespiti
Sistem, belirli bir eşik değeri aşan önemli hareketleri tespit etmek için fiyatı sürekli izler (İmpuls Tetikleyici 🎯).
Fiyat mevcut trend çizgisinden yeterince uzaklaştığında, gösterge potansiyel yön değişikliğini tanır ve ana çizgisini yeniden konumlandırır.
2️⃣ Dinamik Takip
Yön belirlendikten sonra, trend çizgisi piyasa ile aynı yönde adım adım 🪜 hareket eder.
Her adım, mevcut volatiliteye (ATR 📈) göre hesaplanır:
• Daha volatil piyasalarda, adımlar daha büyüktür 🌊
• Daha sakin piyasalarda, adımlar daha küçüktür 🌿
3️⃣ Volatilite Kanalı
Ana çizgi etrafında (üst ve alt bantlar) normal volatilite bölgesini temsil eden bir kanal oluşur 📉📈.
Bu kanal, fiyatın normal parametreler içinde mi davrandığını yoksa aşırı hareketler 🚨 yapıp yapmadığını belirlemeye yardımcı olur.
📏 Volatilite Kanalı
• Üst Bant: Volatilite kanalının üst sınırı
• Alt Bant: Volatilite kanalının alt sınırı
✨ Yeniden Test Sinyalleri
• Cam Göbeği Yıldızlar 🌟: Fiyat, bir yükseliş trendi sırasında alt banda dokunur veya onu geçer
• Macenta Yıldızlar ⭐: Fiyat, bir düşüş trendi sırasında üst banda dokunur veya onu geçer
⚙️ Parametre Ayarları
🔹 Ana Parametreler
İmpuls Tetikleyici (varsayılan değer: 4)
Ne işe yarar?
Trend değişikliklerini tespit etme duyarlılığını belirler. Fiyatın yön değişikliğini tetiklemesi için ne kadar hareket etmesi gerektiğini tanımlayan ATR çarpanıdır.
Değiştirildiğinde etkisi:
• Daha yüksek değerler (5–8):
- Trendlere karşı daha dirençli 🛡️
- Daha az yanlış sinyal
- Gerçek değişimlere daha yavaş tepki
• Daha düşük değerler (2–3):
- Daha yüksek duyarlılık 🎯
- Daha hızlı tepki
- Yanlamasına piyasalarda yanlış sinyaller üretme olasılığı daha yüksek
Maksimum Adım (varsayılan değer: -0.044)
Ne işe yarar?
Trend çizgisinin alabileceği her adımın maksimum boyutunu sınırlar. Negatif bir değer olarak üst sınır görevi görür.
Değiştirildiğinde etkisi:
• Daha az negatif (-0.020 ile -0.030):
- Daha büyük adımlar 🚀
- Daha agresif trend takibi
• Daha negatif (-0.050 ile -0.080):
- Daha küçük, daha kademeli adımlar 🌱
- Daha muhafazakar takip
Kanal Genişliği (varsayılan değer: 2)
Ne işe yarar?
Ana çizgi etrafındaki volatilite kanalının genişliğini tanımlar.
Değiştirildiğinde etkisi:
• Daha yüksek değerler (3–4):
- Daha geniş kanal 🟢
- Daha az yeniden test sinyali
- Volatiliteye karşı daha yüksek tolerans
• Daha düşük değerler (1–1.5):
- Daha dar kanal 🔴
- Daha fazla yeniden test sinyali
- Gürültüye karşı daha fazla duyarlılık
🎨 Görsel Parametreler
Boğa Rengi / Ayı Rengi
Sırasıyla yükseliş ve düşüş trendleri için renkleri tanımlar.
Kanal Dolgusunu Göster
Volatilite kanalının görsel dolgusunu etkinleştirir veya devre dışı bırakır 🌈.
🔔 Yeniden Test Ayarları
Yeniden Test Uyarılarını Etkinleştir
Fiyat kanal bantlarına dokunduğunda yeniden test sinyallerini açar veya kapatır.
Yön Filtreleme
Etkinleştirildiğinde, sadece mevcut trende uygun yeniden test sinyallerini gösterir:
• Bir yükseliş trendinde: Sadece alt banttaki sinyaller
• Bir düşüş trendinde: Sadece üst banttaki sinyaller
🌟 Yeniden Test Sinyalleri Özeti
• Alt Bantta Cam Göbeği Yıldızı: Dinamik destekten potansiyel boğa sıçraması ✅
• Üst Bantta Macenta Yıldızı: Dinamik dirençten potansiyel ayı sıçraması ❌
Özet
Müşteri değerlendirmeleri
5 | 100 % | |
4 | 0 % | |
3 | 0 % | |
2 | 0 % | |
1 | 0 % |


