

Açıklama
Derin Duygu Dağılımı (DMD) 📊🧠
Genel Bakış
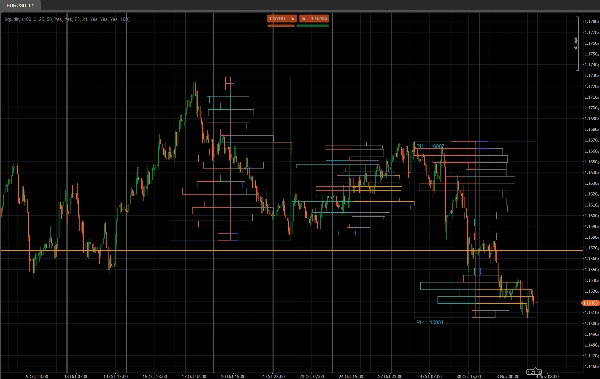
Derin Duygu Dağılımı (DMD), sabit bar bloklarında fiyat hareketini analiz eden segmentli bir hacim profili ve duygu aracıdır ve şunları gösterir:
- Ticaret aktivitesinin nerede yoğunlaştığını ⚖️
- Likiditenin ince veya tepkisel olduğu yerleri (potansiyel Arz & Talep / likidite bölgeleri) 💧
- Her fiyat alanında hangi tarafın hakim olduğunu (alıcılar vs satıcılar) 🐂🐻
Tek bir kayan profil yerine, DMD grafiği tekrarlayan X bar bloklarına böler ve her blok için ayrı bir likidite ve duygu haritası oluşturur.
Bu, hacim dağılımının ve piyasa ruh halinin bir segmentten diğerine nasıl değiştiğini görsel olarak karşılaştırmayı kolaylaştırır.
Nasıl çalışır 🧩
Her Profildeki Barlar bloğu için mumlar:
- Gösterge, o bloğun en yüksek ve en düşük fiyatını bulur.
- Fiyat aralığı
Satır Sayısıdikey fiyat kutularına bölünür. - Bloktaki her mum için:
-
- Tick hacmi, mumun aralığı tarafından dokunulan her fiyat kutusuna dağıtılır.
- Her satır için iki hacim toplanır:
-
- O fiyat satırındaki toplam hacim
- Boğa hacmi (sadece Kapanış > Açılış olan barlar)
- Bunlardan DMD şunları oluşturur:
-
- Likidite profili (sağ taraf)
-
- Satır uzunluğu ∝ bloğun maksimum satır hacmine göre göreceli hacim
- Renk, yüksek / ortalama / düşük işlem gören düğümleri gösterir
- Duygu profili (sol taraf)
-
- Satır başına duygu =
2 × BoğaHacmi − ToplamHacim - Pozitif = alıcıların hakim olduğu (boğa havası)
- Negatif = satıcıların hakim olduğu (ayı havası)
- Satır başına duygu =
- İşlem, son N blok için tekrarlanır, böylece birkaç segment yan yana karşılaştırılabilir.
Sağ Taraf – Likidite Profili (Hacim) 📊
Sağ taraf çubukları, her fiyat seviyesinde ne kadar ticaret aktivitesi (hacim) olduğunu gösterir o blok içinde, alıcı veya satıcının kim olduğuna bakılmaksızın.
- Yüksek hacimli düğümler (HVN) – örn. turuncu çubuklar
-
- Hacmi, bloğun maksimum satır hacminin ≥
Yüksek İşlem Eşiği %olan bir satır - Değer alanlarını, yoğun ticareti, konsolidasyon bölgelerini temsil eder.
- Hacmi, bloğun maksimum satır hacminin ≥
- Düşük hacimli düğümler (LVN) – örn. mavi çubuklar
-
- Hacmi, maksimum satır hacminin ≤
Düşük İşlem Eşiği %olan bir satır - İnce likidite bölgelerini, olası reddetme veya hızlı hareket alanlarını temsil eder.
- Hacmi, maksimum satır hacminin ≤
- Ortalama hacimli düğümler – örn. gri çubuklar
-
- Yüksek ve düşük eşikler arasındaki her şey
- “Normal” işlem gören seviyeler, aşırı olmayan.
🧠 Çubuğun uzunluğu (sağ taraf)
→ O fiyat satırındaki toplam işlem hacmine bloğun maksimum hacmine göre orantılıdır.
Daha fazla hacim → daha uzun çubuk.
Ana parametreler:
Yüksek İşlem Eşiği %Düşük İşlem Eşiği %
Sol Taraf – Duygu Profili (Piyasa Hali) 🧠📉📈
Sol taraf çubukları, her fiyat seviyesindeki duygu / hakimiyeti gösterir: o satırda alıcıların mı yoksa satıcıların mı daha güçlü olduğunu.
Her satır için:
Duygu=2×BoğaHacmi−ToplamHacim\text{Duygu} = 2 \times \text{BoğaHacmi} - \text{ToplamHacim}Duygu=2×BoğaHacmi−ToplamHacim
- Boğa çubuğu (alıcılar kontrolünde) – örn. camgöbeği/yeşil çubuklar
-
- Duygu > 0
- O fiyatta daha fazla hacim boğa mumlarından (Kapanış > Açılış) geldi.
- O fiyat satırında alıcı hakimiyetini gösterir.
- Ayı çubuğu (satıcılar kontrolünde) – örn. kırmızı çubuklar
-
- Duygu < 0
- O fiyatta daha fazla hacim ayı mumlarından (Kapanış < Açılış) geldi.
- O satırda satıcı hakimiyetini gösterir.
🧠 Çubuğun uzunluğu (sol taraf)
→ Duygunun mutlak değerine (|Duygu|) bloğun en güçlü satırına göre orantılıdır.
Daha güçlü hakimiyet (alıcılar ve satıcılar arasında büyük dengesizlik) → daha uzun çubuk.
Ana parametre:
Duygu Profilini Göster(açık/kapalı)
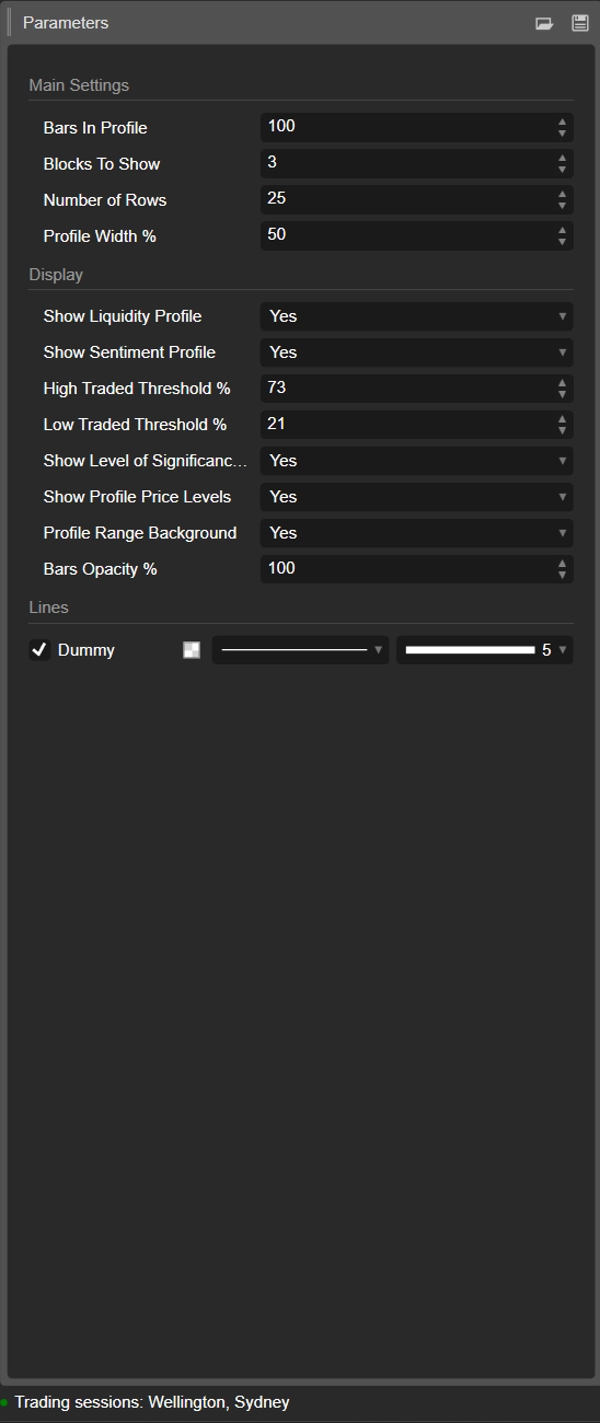
Parametre Detayları ⚙️
1. Profildeki Barlar
Grup: Ana Ayarlar
Her blokta bulunan mum sayısı.
- Örnek:
Profildeki Barlar = 100 -
- Blok 0 → son 100 bar
- Blok 1 → önceki 100 bar
- Blok 2 → önceki 100, ve devamı.
Blokları eşleştirmek için kullanın:
- yaklaşık seanslar,
- tipik swing / intraday aralığınız,
- veya analiz etmek istediğiniz herhangi bir özel pencere.
Daha küçük değer = daha tepkisel, daha ayrıntılı.
Daha büyük değer = daha yumuşak, daha “makro” yapı.
2. Gösterilecek Bloklar
Grup: Ana Ayarlar
Grafikte kaç ardışık blok çizileceği.
1→ sadece en son blok2–3→ karşılaştırma için çok pratik, karmaşık değil- Daha yüksek değerler → daha fazla geçmiş, ancak daha fazla grafik nesnesi
Bu değerin ötesindeki eski bloklar, stabiliteyi korumak için otomatik olarak temizlenir.
3. Satır Sayısı
Grup: Ana Ayarlar
Her bloğun profilinin dikey çözünürlüğü.
Blok fiyat aralığı bu kadar satıra (fiyat seviyesine) bölünür.
- Daha yüksek değer → daha fazla detay, daha ince satırlar, daha fazla dikdörtgen
- Daha düşük değer → daha yumuşak yapı, okunması daha kolay
Tipik aralıklar:
15–25normal intraday kullanım için30–40+çok ince çözünürlük istiyorsanız ve platformunuz yeterince güçlü ise
4. Profil Genişliği %
Grup: Ana Ayarlar
Profilin bloğun merkezinden yatay olarak ne kadar uzağa uzandığını, bloğun genişliğinin yüzdesi olarak kontrol eder.
- Hem likiditeyi (sağ taraf) hem de duyguyu (sol taraf) etkiler.
- Daha yüksek % → profiller çevredeki barlara daha fazla uzanır
- Daha düşük % → bloğun merkezine yakın daha kompakt profil
İyi başlangıç değerleri: 35–50%.
5. Likidite Profilini Göster
Grup: Görüntüleme
Her bloğun sağ tarafındaki hacim dağılımını (likidite profilini) açar veya kapatır.
- Açık ✅
-
- Her satırın uzunluğu, o fiyat seviyesindeki göreceli işlem hacmini yansıtır.
- Renk, yüksek / ortalama / düşük işlem gören düğümleri kodlar.
- Kapalı ❌
-
- Sadece duygu (etkinse) gösterilir, sağda hacim çubukları yoktur.
6. Duygu Profilini Göster
Grup: Görüntüleme
Her bloğun sol tarafındaki duygu profilini açar veya kapatır.
- Açık ✅
-
- Satırlar renklendirilir:
-
- Boğa (alıcılar hakim) – örn. aqua/yeşil
- Ayı (satıcılar hakim) – örn. kırmızı
- Satır uzunluğu, hakimiyet gücünü yansıtır.
- Kapalı ❌
-
- Sadece saf likidite/hacim dağılımı gösterilir.
Bunu, sadece nerede hacim işlem gördüğünü değil, kimlerin o seviyelerde daha aktif olduğunu görmek istediğinizde kullanın.
7. Yüksek İşlem Eşiği %
Grup: Görüntüleme
Her blok içindeki yüksek hacimli düğümler (HVN) için eşik değerini tanımlar.
- Bloğun maksimum satır hacminin % olarak ifadesi.
- Örnek: Maks satır hacmi = 10.000; eşik = %70 → ≥ 7.000 hacimli satırlar HVN sayılır.
HVN'ler genellikle şunları işaret eder:
- değer alanları,
- konsolidasyon bölgeleri,
- güçlü pozisyonlanma / adil değer alanları.
8. Düşük İşlem Eşiği %
Grup: Görüntüleme
Bloğun maksimum hacmine göre düşük hacimli düğümler (LVN) için eşik değerini tanımlar.
- Bu yüzde altındaki hacme sahip satırlar düşük aktivite bölgeleri olarak kabul edilir.
- Bunlar şunlar olarak işlev görebilir:
-
- ince likidite cepleri,
- potansiyel reddetme seviyeleri,
- veya fiyatın hızlı hareket etme eğiliminde olduğu alanlar.
Tipik kullanım: %15–30.
9. Önem Seviyesi Göster (POC)
Grup: Görüntüleme
En son blok için Kontrol Noktası (POC) gösterir veya gizler.
- POC = o blokta en yüksek işlem hacmine sahip fiyat satırı.
- O fiyat seviyesinde yatay bir çizgi olarak gösterilir. 🎯
Şu amaçlarla faydalıdır:
- ortalama dönüş referansı,
- intraday “adil fiyat” sabiti,
- veya işlem yönetimi için ana seviye.
10. Profil Fiyat Seviyelerini Göster
Grup: Görüntüleme
Şu metin etiketlerini gösterir:
- Profil Yüksek (PH) – blokta ulaşılan en yüksek fiyat
- Profil Düşük (PL) – blokta ulaşılan en düşük fiyat
Etiketler en son blok için gösterilir ve tam fiyat değerlerini içerir.
Şunlar için mükemmeldir:
- mevcut aralığı hızlıca okumak,
- PH/PL çevresinde durdurma/ hedef belirlemek,
- kopuşlar veya dönüşler için bağlam sağlamak.
11. Profil Aralığı Arka Planı
Grup: Görüntüleme
Her bloğun şunları kapsayan yarı saydam bir arka plan dikdörtgeni çizer:
- zaman aralığı (başlangıçtan bitiş bara)
- fiyat aralığı (düşükten yükseğe)
Bu, blokları görsel olarak ayırır ve her aralığın öne çıkmasını sağlar.
Daha temiz, minimal bir görünüm tercih ediyorsanız bunu devre dışı bırakın.
12. Bar Opaklığı %
Grup: Görüntüleme
Dikdörtgenlerin (hem likidite hem duygu çubukları) ne kadar opak veya hafif olduğunu kontrol eder.
- %20–40 → çok hafif, arka plan tarzı
- %50–70 → dengeli görünürlük, mumlar hala kolayca görülebilir
- %80–100 → güçlü, neredeyse tamamen opak bloklar
Bu değer dahili olarak çubuk renkleri için alfa kanalına (0–255) dönüştürülür.
Önerilen başlangıç şablonu ⭐
Endeksler / vadeli işlemler intraday (M5–M15) için:
- Profildeki Barlar: 80–120
- Gösterilecek Bloklar: 2–3
- Satır Sayısı: ~20
- Profil Genişliği %: 35–45
- Likidite Profilini Göster: true
- Duygu Profilini Göster: true
- Bar Opaklığı %: 50–65
Özet
Key features include:
- Liquidity Profile (right side): Displays trading volume concentration at each price level within a block, highlighting high-volume nodes (HVNs), low-volume nodes (LVNs), and average-volume nodes. Bar length corresponds to relative traded volume, and colors indicate volume intensity.
- Sentiment Profile (left side): Shows buyer vs. seller dominance per price level, calculated as twice the bullish volume minus total volume. Positive values indicate buy-side control; negative values indicate sell-side control. Bar length reflects the strength of dominance, with color coding for bullish (green/teal) and bearish (red) sentiment.
- Configurable parameters: number of bars per profile block, number of blocks displayed, vertical resolution (rows), profile width, opacity, and thresholds for defining HVNs and LVNs.
- Additional display options: Point of Control (POC) line for highest volume price in the latest block, profile high/low price labels, and background shading for block ranges.
DMD supports analysis across various markets including indices, commodities, forex, and cryptocurrencies, facilitating identification of trading activity concentration, liquidity zones, and market sentiment shifts within customizable timeframes.
Müşteri değerlendirmeleri
5 | 0 % | |
4 | 100 % | |
3 | 0 % | |
2 | 0 % | |
1 | 0 % |


