
RT Consolidation Zones
Indicatore
1 acquisti
Versione 1.0, Sep 2024
Windows, Mac
Descrizione
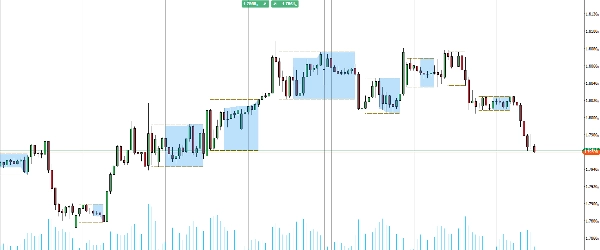
Presentiamo l'indicatore Consolidation Zones, progettato per aiutarti a identificare e sfruttare con facilità le opportunità di breakout.
Questo potente strumento evidenzia le zone sul tuo grafico in cui il prezzo si sta consolidando, rendendo semplice individuare i potenziali punti di breakout. Visualizzando queste aree critiche, puoi anticipare meglio i movimenti di mercato e prendere decisioni di trading più informate.
Ideale per i trader che desiderano migliorare la propria strategia con intuizioni chiare e pratiche, aggiorna la tua cassetta degli attrezzi per il trading e padroneggia i breakout con l'indicatore Consolidation Zones.
Riepilogo
Profilo indicatore
Recensioni dei clienti
0.0
Recensioni: 0
Recensioni dei clienti
Questo prodotto non ha ancora ricevuto recensioni. L'hai già provato? Fallo sapere agli altri per primo!
Discussioni
Domande frequenti
BTCUSD
Forex
Breakout
Indices
EURUSD
Commodities
GBPUSD
NZDUSD
Prop
Crypto
Stocks
XAUUSD
NAS100
USDJPY
I prodotti disponibili tramite cTrader Store, inclusi bot di trading, indicatori e plugin, sono forniti da sviluppatori terzi e resi disponibili esclusivamente a scopo informativo e di accesso tecnico. cTrader Store non è un broker e non fornisce consulenze in materia di investimento, raccomandazioni individualizzate o garanzie di risultati futuri.


Prezzo
Da 25/09/2024
20
Vendite