
Описание
Ключевые особенности
- Динамический стоп на основе ATR: Автоматически адаптирует расстояние трейлинг-стопа к текущей волатильности рынка — шире в условиях высокой волатильности, уже на спокойных рынках
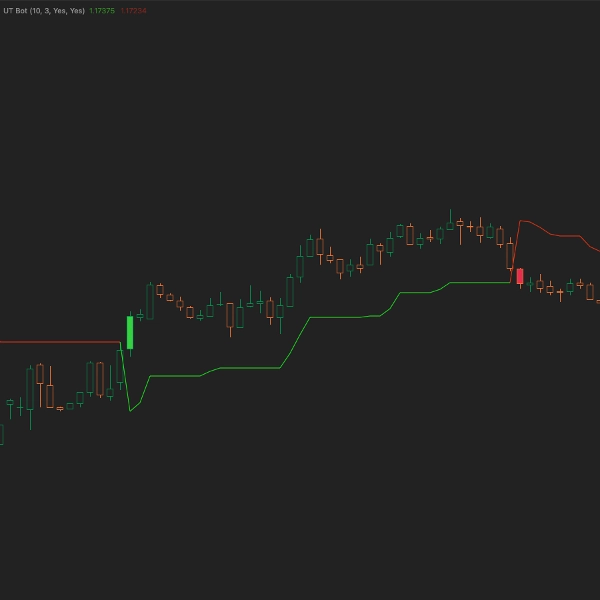
- Чёткие визуальные сигналы: Лаймовая полоса для восходящего тренда, багровая полоса для нисходящего — определяйте направление тренда с первого взгляда без загромождения графика
- Опциональные оповещения: Включайте всплывающие уведомления и звуковые сигналы, чтобы быть в курсе изменений тренда даже вдали от экрана
- Окраска баров по сигналам: Бары мгновенно окрашиваются при развороте тренда, давая визуальное подтверждение, когда цена пересекает уровень трейлинг-стопа
Как это работает
UT Bot рассчитывает трейлинг-стоп на основе периода ATR, умноженного на ваш параметр чувствительности. Когда цена выше стопа, тренд бычий. Когда цена пересекает вниз, тренд меняется на медвежий. Индикатор отслеживает эти переходы и окрашивает бары, сигнализируя о потенциальных входах или выходах.
Трейлинг-стоп движется только в направлении тренда — он поднимается во время восходящих трендов и опускается во время нисходящих, фиксируя прибыль и давая сделкам пространство для манёвра.
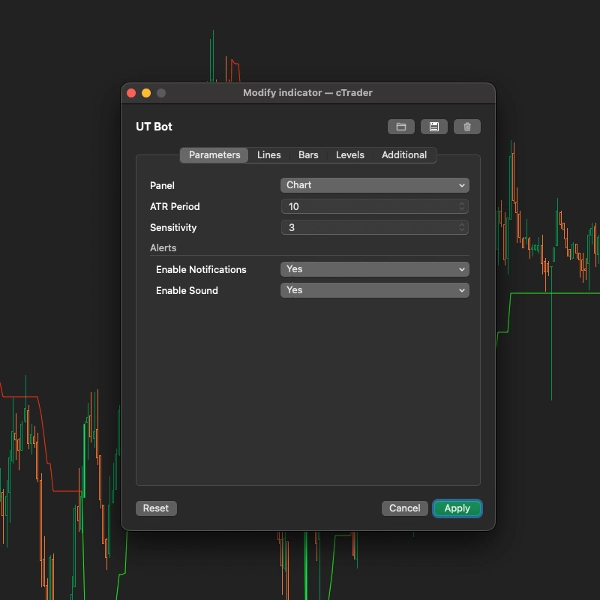
Параметры
Основные настройки
- Период ATR (по умолчанию: 10): Количество баров, используемых для расчёта Average True Range. Более высокие значения = более сглаженные, но медленные сигналы
- Чувствительность (по умолчанию: 3.0): Множитель для расстояния ATR. Более высокие значения создают более широкий трейлинг-стоп (меньше ложных сигналов, более поздние входы). Более низкие значения создают более плотные стопы (больше сигналов, больше ложных разворотов)
Настройки оповещений
- Включить уведомления (по умолчанию: False): Показывать всплывающие оповещения при изменении тренда
- Включить звук (по умолчанию: False): Воспроизводить звук при изменении тренда (положительный звук для бычьего, отрицательный для медвежьего)
Идеально подходит для
- Трейдеров тренда, которым нужна динамическая установка стоп-лосса
- Трейдеров, желающих чётко видеть направление тренда
- Тех, кто ищет механическую систему следования за трендом
- Скальперов и свинг-трейдеров (соответственно настраивайте чувствительность)
Советы
- Скальпинг: Используйте период ATR 5-7, чувствительность 1.5-2.0 для более быстрых сигналов
- Свинг-трейдинг: Используйте период ATR 10-14, чувствительность 3.0-4.0 для меньшего количества ложных сигналов
- Подтверждение: Сочетайте с объёмом или другими индикаторами для более вероятных входов
Сводка
Key functionalities include detecting bullish and bearish momentum shifts when price crosses the trailing stop, visually signaling these reversals by coloring bars green for bullish flips and red for bearish flips, and drawing adaptive trailing stop bands above or below price. The indicator is non-repainting and overlays directly on the chart for immediate insight.
Users can customize core parameters such as ATR period (default 10) and sensitivity (default 3), and enable optional popup and sound alerts for trend changes. UT Bot is suitable for various markets including Forex, indices, and cryptocurrencies like BTCUSD and XAUUSD. It is recommended to use UT Bot alongside trend filters or volume indicators to enhance confirmation in trending or breakout environments.
Отзывы покупателей
5 | 67 % | |
4 | 33 % | |
3 | 0 % | |
2 | 0 % | |
1 | 0 % |


