
PriceLevels
Индикатор
4 покупки
Версия 1.0, Jan 2025
Windows, Mac
5.0
Отзывы: 2
Описание
Основные характеристики:
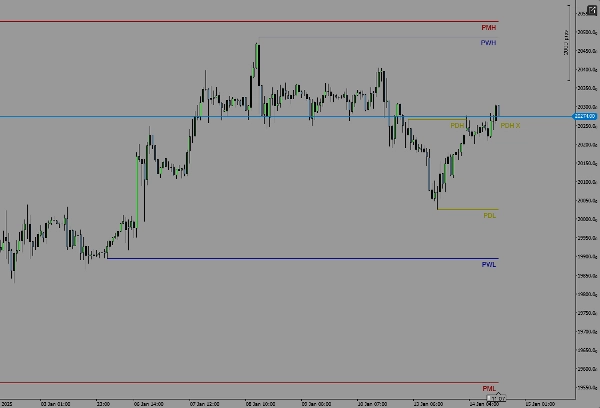
- Отображает максимумы и минимумы вчерашнего дня.
- Отображает максимумы и минимумы прошлой недели.
- Отображает максимумы и минимумы прошлого месяца.
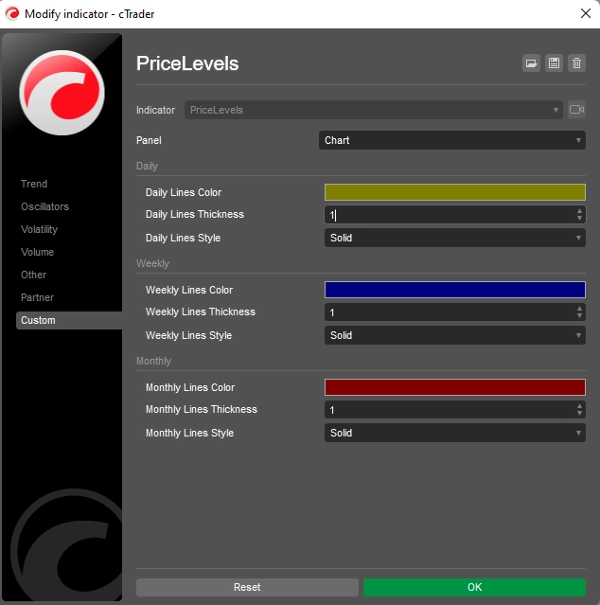
- Настраиваемые цвета и стили линий для каждого уровня.
Как это работает:
Индикатор автоматически рассчитывает максимальные и минимальные цены за предыдущий день, неделю и месяц на основе таймфрейма вашего графика. Эти уровни затем отображаются в виде горизонтальных линий на вашем графике, обеспечивая четкую визуальную ссылку на историческое ценовое движение.
Совместимость:
- Разработан только для платформы cTrader.
- Работает на всех таймфреймах и инструментах.
Если у вас есть вопросы, отзывы или предложения по улучшению, не стесняйтесь обращаться! Ваше мнение очень важно и поможет сделать этот индикатор еще лучше.
Удачной торговли!
Сводка
ИИ-сводка
PriceLevels is an indicator designed for the cTrader platform that automatically calculates and displays key historical price levels on trading charts. It plots the highest and lowest prices from the previous day, last week, and last month as horizontal lines, providing traders with clear visual references for past price action. The indicator supports all timeframes and instruments available on cTrader. Users can customize the colors and line styles for each displayed level to suit their charting preferences. This tool aids in identifying significant support and resistance zones based on recent historical data.
Профиль индикатора
Отзывы покупателей
5.0
Отзывы: 2
5 | 100 % | |
4 | 0 % | |
3 | 0 % | |
2 | 0 % | |
1 | 0 % |
Обсуждение
Частые вопросы
Продукты, доступные в cTrader Store, включая торговых ботов, индикаторы и плагины, предоставляются сторонними разработчиками и доступны исключительно в информационных и технических целях. cTrader Store не является брокером и не предоставляет инвестиционные консультации, персональные рекомендации или какие-либо гарантии будущей доходности.


Цена
С 05/01/2025
14
Продажи