
Supertrend - Multi-Timeframe
Индикатор
1 покупки
Версия 1.0, Oct 2025
Windows, Mac
4.5
Отзывы: 2
Описание
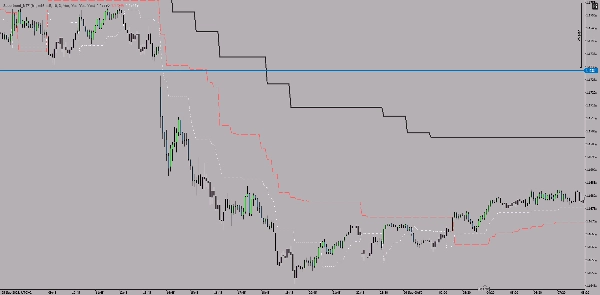
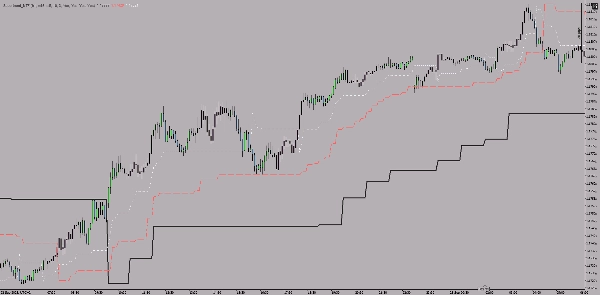
Это индикатор Multi-TimeFrame Supertrend для платформы cTrader, который отображает линии Supertrend из трех разных таймфреймов одновременно на одном графике.
Основные характеристики
Отображение трех параллельных таймфреймов:
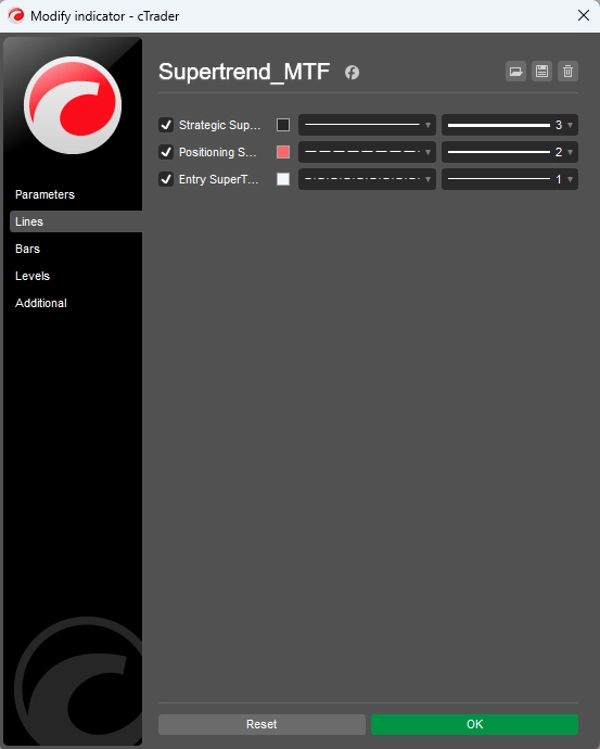
- Стратегический таймфрейм (по умолчанию: 1 час) - толстая, сплошная линия
- Таймфрейм позиционирования (по умолчанию: 15 минут) - линия средней толщины, пунктирная
- Таймфрейм входа (по умолчанию: 5 минут) - тонкая, точечная линия
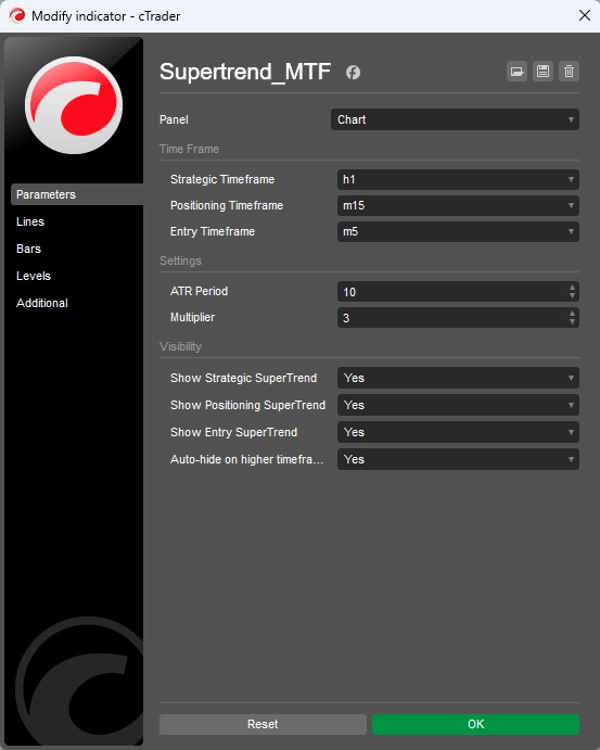
Настраиваемые параметры:
- Период ATR (по умолчанию: 10)
- Множитель (по умолчанию: 3.0)
- Каждый из трех таймфреймов можно включать/выключать отдельно
- Автоматическое скрытие на более высоких таймфреймах (опционально)
Как это работает
Индикатор использует классическую логику Supertrend для всех трех таймфреймов, где:
- Тренд восходящий, когда цена выше линии Supertrend
- Тренд нисходящий, когда цена ниже линии Supertrend
- Различная толщина и стиль линий помогают различать таймфреймы
Назначение
Помогает в анализе на нескольких таймфреймах: больший таймфрейм задает основное направление (стратегию), средний уточняет позиционирование, а самый маленький отмечает конкретные точки входа.
Сводка
ИИ-сводка
The Supertrend - Multi-Timeframe Indicator for the cTrader platform displays Supertrend lines from three distinct timeframes simultaneously on a single chart. It features a strategic timeframe (default 1 hour) shown as a thick solid line, a positioning timeframe (default 15 minutes) as a medium dashed line, and an entry timeframe (default 5 minutes) as a thin dotted line. Each timeframe can be individually enabled or disabled, with customizable settings including ATR period and multiplier. The indicator applies classic Supertrend logic: the trend is considered up when the price is above the Supertrend line and down when below. Different line styles and thicknesses visually distinguish the timeframes. This tool supports multi-timeframe analysis by providing the main directional trend from the larger timeframe, refined positioning from the middle timeframe, and specific entry points from the smallest timeframe. It is applicable across various markets including Forex, indices, commodities, stocks, and cryptocurrencies, and supports symbols such as BTCUSD, EURUSD, GBPUSD, XAUUSD, NAS100, and USDJPY.
Профиль индикатора
Отзывы покупателей
4.5
Отзывы: 2
5 | 50 % | |
4 | 50 % | |
3 | 0 % | |
2 | 0 % | |
1 | 0 % |
Отзывы покупателей
October 13, 2025
The part worth keeping is the setup needs a cleaner reason to exist, and a few ugly trades are useful in the sample.
October 10, 2025
Обсуждение
Частые вопросы
BTCUSD
Forex
Breakout
Indices
EURUSD
Commodities
GBPUSD
NZDUSD
Prop
Scalping
Crypto
Stocks
XAUUSD
NAS100
USDJPY
Продукты, доступные в cTrader Store, включая торговых ботов, индикаторы и плагины, предоставляются сторонними разработчиками и доступны исключительно в информационных и технических целях. cTrader Store не является брокером и не предоставляет инвестиционные консультации, персональные рекомендации или какие-либо гарантии будущей доходности.


Цена
С 05/01/2025
14
Продажи