
Frac Support Resistance V1
Индикатор
2 покупки
Версия 1.0, Nov 2025
Windows, Mac
5.0
Отзывы: 1
Описание
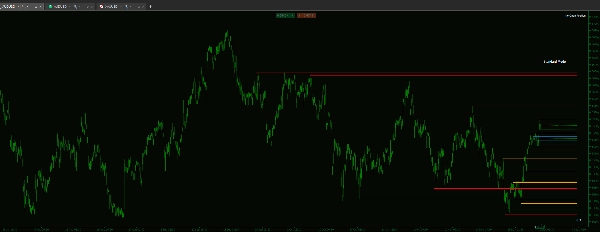
Если вы торгуете, основываясь на структуре рынка, вы знаете, что самые критичные уровни часто устанавливаются на более высоком таймфрейме. Этот пользовательский индикатор решает проблему ручного определения и отслеживания таких уровней.
Этот инструмент предназначен для обеспечения надежной визуальной иерархии, позволяя видеть критические структурные границы и приоритизировать зоны с высокой ценностью, не покидая экран исполнения.
Ключевые особенности и детальный контроль
- Индикатор создан для исключительной производительности и чистой визуализации графика:
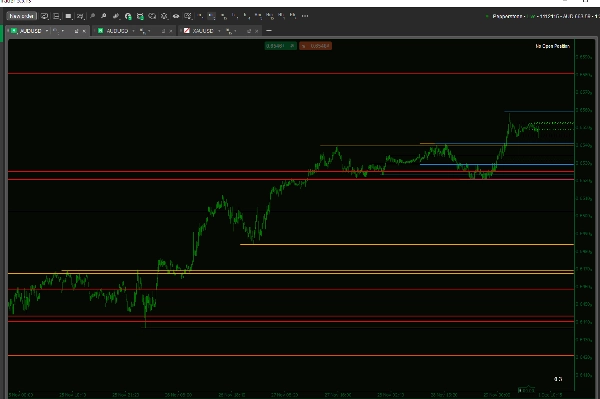
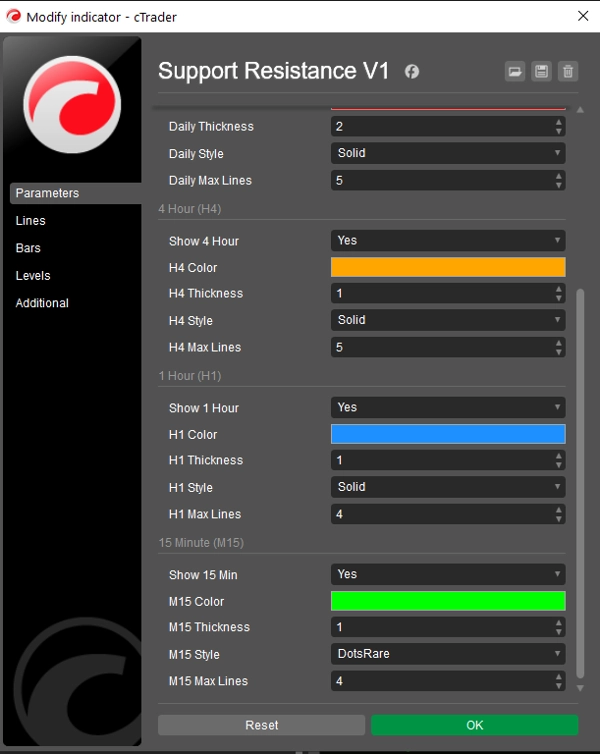
- Истинная визуальная иерархия: Получите независимый контроль над толщиной, стилем линии (Сплошная, Штриховая, Точечная) и цветом для каждого таймфрейма.
- Преимущество: Мгновенно распознавайте силу уровня по его внешнему виду (например, установите линии D1 толстыми/сплошными для основных структур и линии H1 тонкими/пунктирными для ближайших уровней).
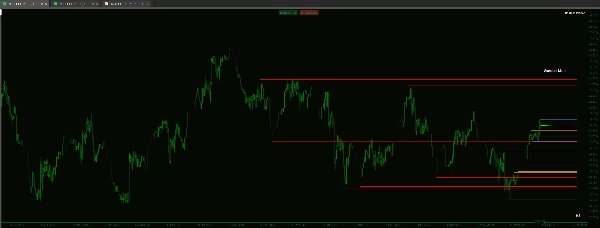
- Контроль производительности и фокуса: Устали от загроможденных графиков? Вы можете ограничить максимальное количество линий, отображаемых для каждого таймфрейма отдельно.
- Пример: Установите максимум линий H4 равным 5, а максимум линий D1 — 15, чтобы приоритизировать недавние уровни на более низких таймфреймах, сохраняя при этом более глубокий обзор основных структур.
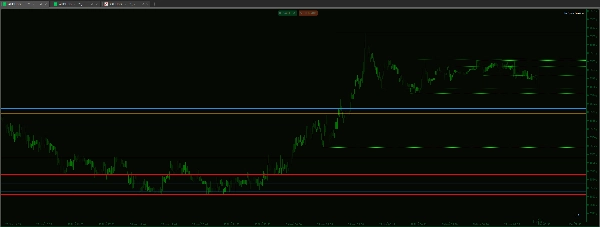
- Чистая основа кода: Построен на надежной фрактальной логике, обеспечивающей, что определённые уровни являются подлинными пивотами максимумов/минимумов, используемыми в стандартном анализе структуры.
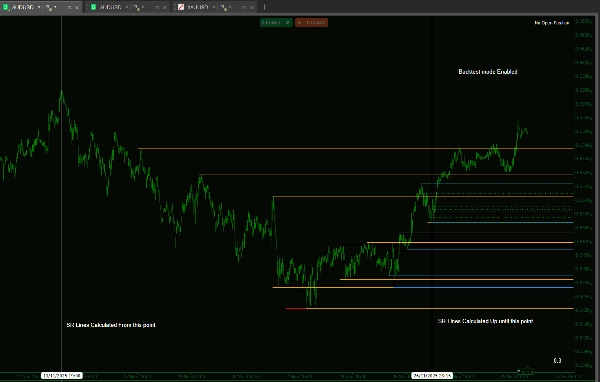
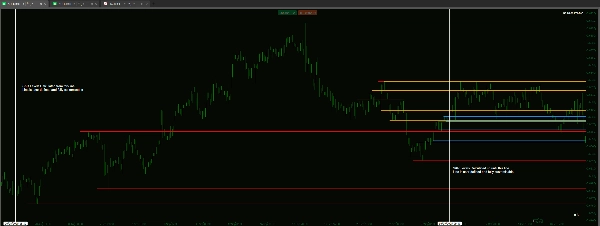
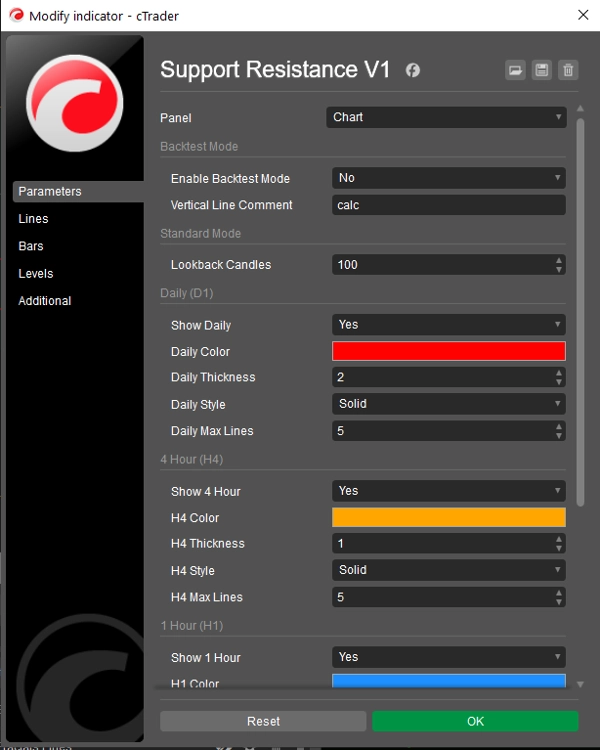
- Специальный режим бэктестинга: Включает функцию ограничения анализа индикатора определённым временным диапазоном на графике. Это важно для точного ручного бэктестинга, имитируя ход времени без предвзятости будущего.
Сводка
ИИ-сводка
Frac Support Resistance V1 is a technical indicator designed to automatically calculate and display smart support and resistance lines derived from multiple timeframes: daily (D1), 4-hour (H4), hourly (H1), and 15-minute (M15). It assists traders who rely on market structure by visually highlighting critical price levels established on higher timeframes, reducing the need for manual identification.
Key features include customizable visual hierarchy, allowing independent adjustment of line thickness, style (solid, dashed, dotted), and color for each timeframe. This enables quick recognition of the relative strength of support and resistance levels. Users can also control chart clarity by setting maximum numbers of lines per timeframe to prioritize recent or major structural levels.
The indicator is based on fractal logic to identify genuine high and low pivots consistent with standard market structure analysis. It includes a dedicated backtesting mode that restricts analysis to a specified historical period, facilitating unbiased manual strategy testing by simulating real-time progression.
Frac Support Resistance V1 supports various markets including Forex, cryptocurrencies, commodities, indices, and stocks, with tags indicating compatibility with symbols like BTCUSD, EURUSD, GBPUSD, XAUUSD, NAS100, and USDJPY. The tool is suited for strategies involving breakout, scalping, smart money concepts, and grid trading.
Профиль индикатора
Отзывы покупателей
5.0
Отзывы: 1
5 | 100 % | |
4 | 0 % | |
3 | 0 % | |
2 | 0 % | |
1 | 0 % |
Отзывы покупателей
December 1, 2025
A small account test feels safer, and the plan becomes easier to stick with, and the chart still needs a final look.
Обсуждение
Частые вопросы
BTCUSD
Forex
Signal
Breakout
Indices
EURUSD
Commodities
GBPUSD
NZDUSD
Prop
Scalping
SMC
Crypto
Grid
Stocks
AI
XAUUSD
NAS100
USDJPY
Продукты, доступные в cTrader Store, включая торговых ботов, индикаторы и плагины, предоставляются сторонними разработчиками и доступны исключительно в информационных и технических целях. cTrader Store не является брокером и не предоставляет инвестиционные консультации, персональные рекомендации или какие-либо гарантии будущей доходности.


![Логотип продукта "Gaussian Channel [Iridio Capital]"](https://cdn.ctrader.com/image/webp/7c039209-5573-4a54-a072-f9528b503103_41960)


Цена
С 14/01/2025
55
Продажи
11.5K
Бесплатные установки