
RT Qualitative Quantity Estimation
Chỉ báo
1 lượt mua
Phiên bản 1.0, Sep 2024
Windows, Mac
Mô tả
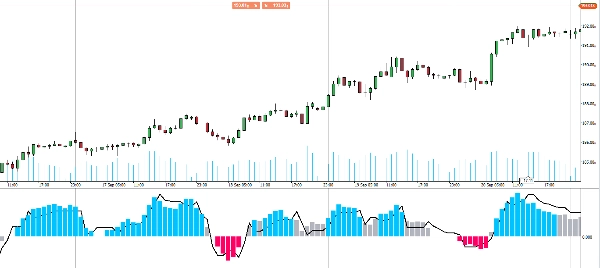
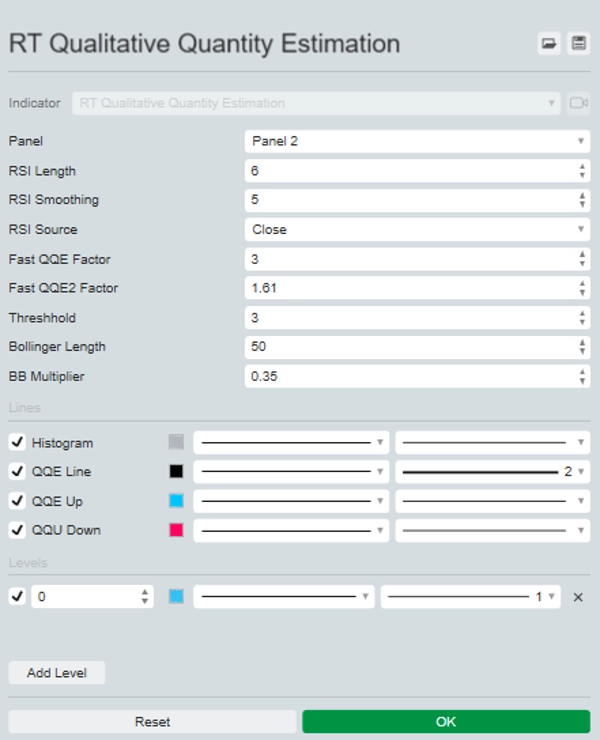
Giới thiệu chỉ báo QQE (Đánh giá Định tính Định lượng) nâng cao, một công cụ mạnh mẽ kết hợp hai chỉ báo QQE để có cái nhìn sâu sắc hơn về giao dịch.
Một QQE được hiển thị trên biểu đồ dưới dạng các cột, trong khi QQE còn lại hoạt động ở nền với dải Bollinger 50 kỳ đóng vai trò như đường số không.
Thiết lập này cho phép bạn đánh giá trực quan động lượng thị trường và xác định các điểm vào tiềm năng một cách rõ ràng. Khi cả hai chỉ báo QQE đồng thuận, bạn sẽ thấy các thanh màu xanh hoặc đỏ rõ ràng, báo hiệu cơ hội mua hoặc bán mạnh.
Nâng cao chiến lược giao dịch của bạn với chỉ báo QQE để có các quyết định thông minh hơn và cải thiện độ chính xác trong phân tích thị trường.
Tóm tắt
Hồ sơ chỉ báo
Đánh giá của khách hàng
0.0
Đánh giá: 0
Đánh giá của khách hàng
Sản phẩm này chưa có đánh giá nào. Bạn đã dùng thử chưa? Hãy là người đầu tiên chia sẻ với mọi người!
Thảo luận
Câu hỏi thường gặp
BTCUSD
Forex
Signal
Indices
EURUSD
Commodities
GBPUSD
NZDUSD
Crypto
Stocks
XAUUSD
NAS100
USDJPY
Các sản phẩm có sẵn trên cTrader Store, bao gồm bot giao dịch, chỉ báo và plugin, được cung cấp bởi các nhà phát triển bên thứ ba và chỉ nhằm mục đích cung cấp thông tin và tiếp cận kỹ thuật. cTrader Store không phải là nhà môi giới và không cung cấp lời khuyên đầu tư, khuyến nghị cá nhân hay bất kỳ đảm bảo nào về hiệu suất trong tương lai.


![Logo "[Stellar Strategies] MARSI Signal Plotter"](https://cdn.ctrader.com/image/webp/7b2b8da6-8f8e-4646-8d4a-4710c516c01e_25567)
Giá
Kể từ 25/09/2024
20
Lượt bán