
Descrizione
Se stai cercando un indicatore dinamico del canale di Fibonacci per cTrader, non cercare oltre. Questo indicatore disegna automaticamente bande di Fibonacci parallele a una media mobile a tua scelta. È facile da usare e, come i miei altri indicatori, fornisce avvisi tramite Pop-up, Suono, Email e messaggi Telegram. Inoltre, hai la flessibilità di personalizzare le Bande, i livelli di Fibonacci e gli Avvisi.
Ecco un elenco delle sue caratteristiche:
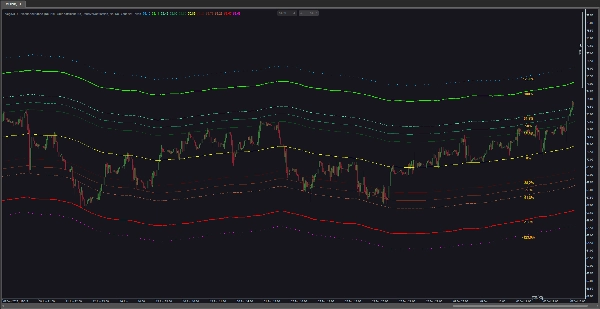
- Calcolo delle Bande di Fibonacci: L'indicatore calcola e traccia le bande di Fibonacci basate sulla media mobile selezionata. Queste bande derivano dai livelli di Fibonacci (ad esempio, 0,0%, 38,2%, 61,8% o altri) e si estendono sopra e sotto la media mobile di un fattore specificato.
- Configurazione della Media Mobile: Personalizza il tipo di media mobile (ad esempio, Semplice, Esponenziale, ecc.) e il numero di periodi utilizzati nel calcolo. La media mobile serve come base per le bande di Fibonacci.
- Funzionalità di Avviso: L'indicatore offre varie opzioni di avviso per notificare i trader su eventi specifici. Questo include avvisi al tocco di livelli di prezzo e avvisi di prossimità.
- Avvisi al Tocco del Livello di Prezzo: Configura l'indicatore per attivare avvisi quando il prezzo tocca specifici livelli di Fibonacci. Gli avvisi possono basarsi sul prezzo di chiusura o immediatamente quando il prezzo tocca il livello.
- Avvisi di Prossimità: Imposta avvisi di prossimità per ricevere notifiche quando il prezzo si avvicina o si allontana da un livello di Fibonacci specificato entro una distanza definita. Gli avvisi possono attivarsi quando il prezzo si avvicina o si allontana dal livello.
- Opzioni di Uscita degli Avvisi: Scegli tra avvisi sonori, pop-up, messaggi Telegram e notifiche email per gli avvisi. Gli avvisi sonori possono essere personalizzati selezionando diversi file audio.
- Opzioni di Visualizzazione: Personalizza la visualizzazione dei livelli di Fibonacci con opzioni come la visualizzazione dei valori percentuali, l'impostazione del colore per le etichette percentuali, il controllo della posizione delle etichette sul grafico, l'abilitazione/disabilitazione di bande specifiche e la scelta del colore, dello spessore e dell'aspetto delle bande.
- Livelli di Fibonacci Configurabili: Adatta l'indicatore alla tua strategia di trading regolando i livelli specifici di Fibonacci utilizzati nel calcolo. I livelli di Fibonacci positivi e negativi possono essere personalizzati individualmente.
- Guida Utente Integrata: Puoi accedere alla guida utente di questo indicatore direttamente dal grafico.
In sintesi, l'indicatore VegaXLR - Fibonacci Bands combina l'analisi di Fibonacci e le medie mobili per aiutare a identificare potenziali livelli di supporto e resistenza. Con funzionalità di avviso configurabili e opzioni di visualizzazione, è uno strumento prezioso per i trader che si affidano ai ritracciamenti o alle espansioni di Fibonacci.
Riepilogo
It features multiple alert options including price level touch alerts—triggered on price contact or close at specified Fibonacci levels—and proximity alerts that notify when price approaches or moves away from these levels within a defined range. Alerts can be delivered via pop-up, sound (with customizable sounds), email, and Telegram messages.
Visualization settings enable customization of band colors, thickness, label display and position, and selective enabling or disabling of bands. A built-in user guide is accessible directly from the chart for ease of use.
Overall, VegaXLR - Fibonacci Bands combines Fibonacci retracement and expansion analysis with moving averages to assist traders in identifying potential support and resistance zones, enhanced by configurable alerts and visualization options.
Recensioni dei clienti
5 | 100 % | |
4 | 0 % | |
3 | 0 % | |
2 | 0 % | |
1 | 0 % |


