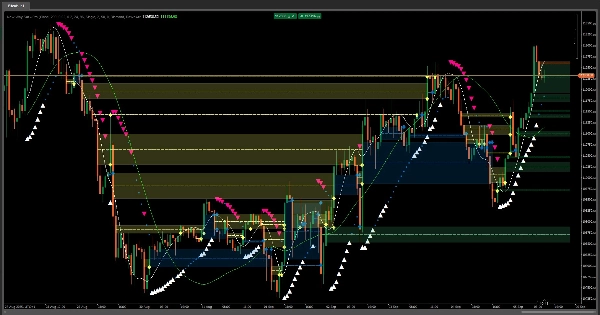
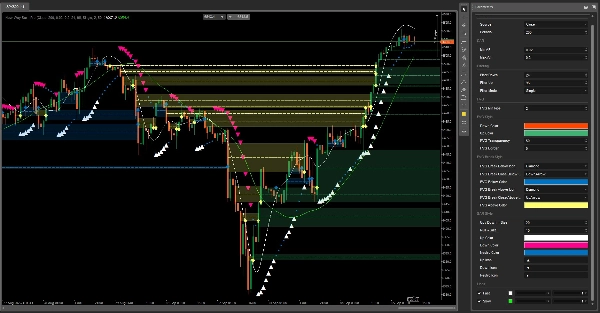
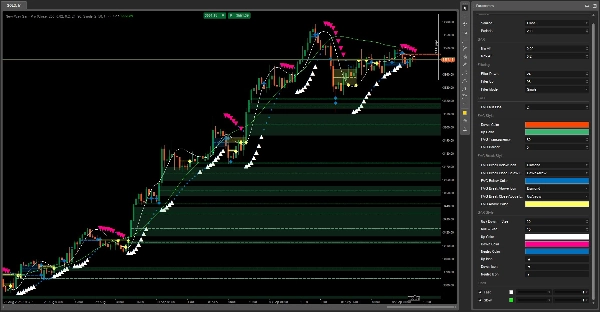
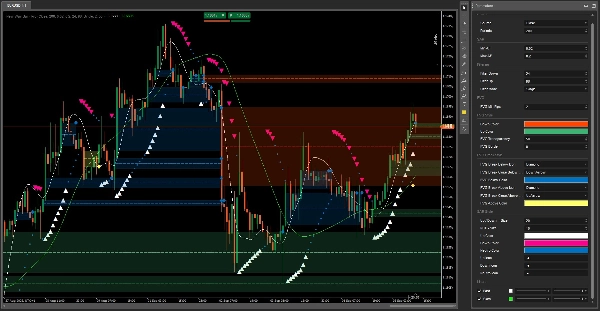
Logo di "New Way Sar - Pro"
New Way Sar - Pro
5.0
Recensioni: 1
Immagine caricata di "New Way Sar - Pro"
135
Vendite
10.48K
Installazioni gratuite

The Parabolic SAR, or "Stop and Reverse," is a dynamic technical analysis tool that helps traders identify potential trend reversals and set trailing stop-loss orders. Unlike traditional indicators, the Parabolic SAR creates a series of dots that follow the price movement, adjusting as the trend gains momentum.

Our modern version offers a fresh, intuitive approach to this classic indicator. By combining powerful, reliable signals with a clean and modern design, it helps traders easily visualize trend direction and potential entry or exit points. By integrating key market levels like Fair Value Gaps, this version provides a comprehensive system for making more precise and confident trading decisions, giving you the clarity needed to navigate the markets with confidence.

Indicator profile
5.0
Recensioni: 1
5
100 %
4
0 %
3
0 %
2
0 %
1
0 %
Recensioni dei clienti
October 8, 2025
Smooth and smart SAR! ๐Ÿ”„ Adapts to volatility, cuts false flips, and keeps your trades on trend. Perfect for swing and trend lovers who want cleaner signals without the noise."
Prop
Forex
Signal
Scalping
Indices
Commodities
Supertrend
Crypto
Stocks
Products available through cTrader Store, including trading bots, indicators and plugins, are provided by third-party developers and made available for informational and technical access purposes only. cTrader Store is not a broker and does not provide investment advice, personal recommendations or any guarantee of future performance.

Altro da questo autore

Logo di "VWAP-Free"
5.0
(2)
Gratis
VWAP only timeframe
๐Ÿ˜ŽRead the description before purchasing๐Ÿ’ฉ
This indicator consists of 3 moving averages that can be configured to your liking, from the type of moving average....
This technical analysis indicator provides information on market sentiment, trend and price levels....
This bot can automatically generate buy and sell orders based on three specific Fixed bugs.
๐Ÿ˜ŽRead the description before purchasing๐Ÿ’ฉ
Logo di "AllPattern"
5.0
(2)
Gratis
๐Ÿ” Discover All Candlestick Patternsโ€ฆ Absolutely Free!
With this Fibonacci retracement indicator, traders have full control over the retracement levels displayed on the chart.
Session One is a tool for marking from to, useful if you've set the hours you want to trade
A straightforward yet effective tool signals entry points for both buying and selling. Include 3 Moving Average
The Parabolic SAR, or "Stop and Reverse," is a dynamic technical analysis tool.
๐Ÿš€ HAI QUANTUM v4.0 | The Ultimate Quantum Terminal for cTrader (Smart Money & Algorithmic Trading)

Potrebbe interessarti anche

PrimeTrend: ATR trendline detects reversals, plots entry/SL/3 targets. Tune params (speed vs. robustness). Backtest +
The Multi-Timeframe Candle Indicator displays candles from multiple timeframes in one window, enhancing market analysis!
Trend Cycle โ€“ measure the life of your trends. See how long the current move has been running and how long similar trend
The Dynamic Refined RSI smooths traditional RSI signals, improving accuracy and reducing market noise.
Pinpoint FVGs, track fills and see mitigation stats โ€” trade imbalances with clarity and confidence.
Easily visualise Forex sessions with start/end markers and high/low levels for Sydney, Tokyo, London, and New York.
show symbol and time fram, daily net profit percent, daily net profit, and spread ln your chart. consider that timezone
๐Ÿ“ˆ Trading Sessions Indicator โ€” London, New York & Tokyo Visualize Key Market Sessions + High/Low Levels with Precision
setup tabajara de graรงa
ZigZag Pro โ€” Advanced swing detection with ATR threshold, fractal confirmation, and colored segments. Clean market
Dark Poll Signal Indicator
Track major trading sessions (Tokyo, London, New York) with customizable colors and visual sessions on your chart.
RSI T3 overbought and oversold area
Hammer Pattern Indicator
Squeeze Momentum Indicator detects market consolidation periods and momentum breakouts using Bollinger Bands.
Adaptive Swing-Anchored VWAP that tracks market structure shifts with precision and clarity.
The QQE indicator is a technical analysis tool designed to identify potential trend changes and trading signals ๐Ÿ“ˆ๐Ÿ“‰
๐Ÿ  Free trend baseline - without the noise. Free limited version of Coral Filter X Pro ๐Ÿ 
135
Vendite
10.48K
Installazioni gratuite