
HIGHS LOWS AEGIS
Wskaźnik
1 zakupy
Wersja 1.0, Dec 2025
Windows, Mac
5.0
Opinie: 2
Opis
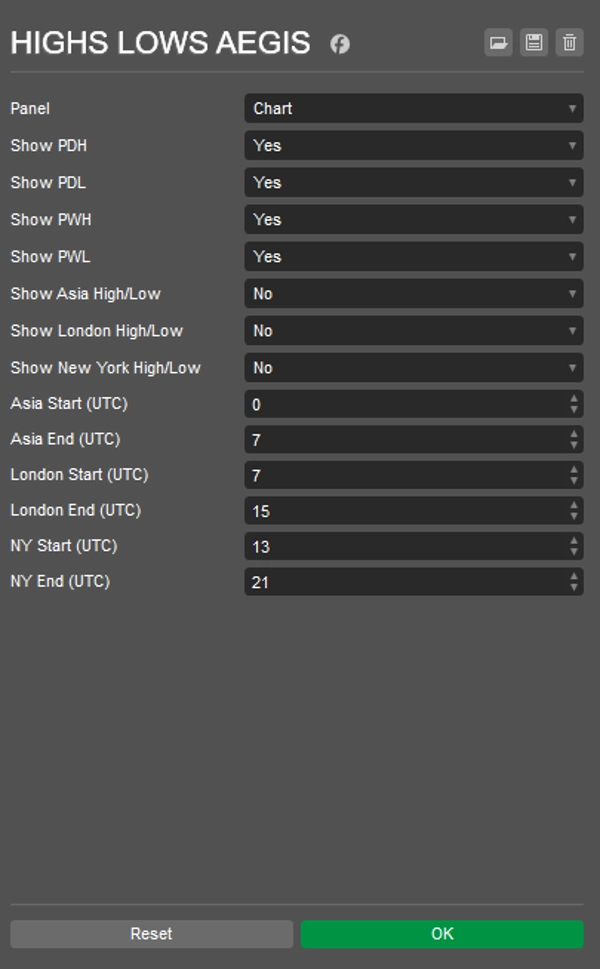
Prosty wskaźnik pokazujący wybrane maksima i minima.
- Minimum/Maksimum poprzedniego dnia
- Minimum/Maksimum poprzedniego tygodnia
- Sesje Azja/Londyn/Nowy Jork - minimum/maksimum
- Dostosowywany czas UTC dla każdego początku/końca sesji
Oznaczone linie dla lepszego rozróżnienia, co jest czym.
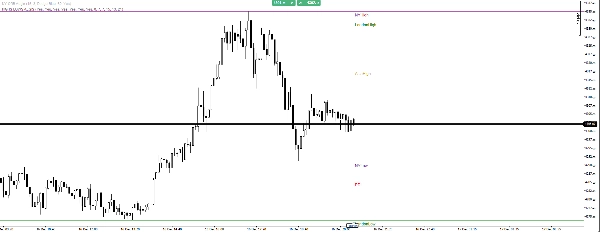
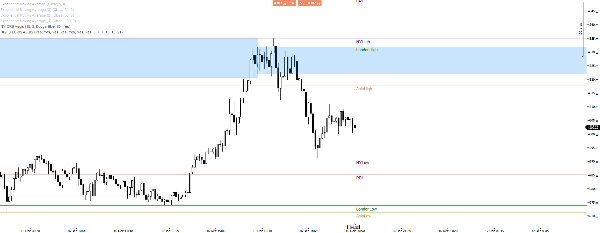
Dobre zastosowanie z niemal każdą strategią, używam go z ORB, co znacznie pomaga unikać fałszywych wybicia, jak na dzisiejszym obrazku z XAUUSD.
Podsumowanie
Profil wskaźnika
Opinie klientów
5.0
Opinie: 2
5 | 100 % | |
4 | 0 % | |
3 | 0 % | |
2 | 0 % | |
1 | 0 % |
Opinie klientów
December 27, 2025
December 24, 2025
weak ideas are easier to skip, but it should stay in the support stack.
Dyskusja
Częste pytania
Prop
Forex
Breakout
Scalping
Indices
EURUSD
Commodities
SMC
Stocks
XAUUSD
NAS100
Produkty dostępne za pośrednictwem cTrader Store, w tym boty handlowe, wskaźniki i wtyczki, dostarczane są przez deweloperów zewnętrznych i udostępniane wyłącznie w celach informacyjnych oraz w celu zapewnienia dostępu technicznego. cTrader Store nie jest brokerem i nie zapewnia doradztwa inwestycyjnego, nie udziela spersonalizowanych rekomendacji ani nie gwarantuje przyszłych wyników.


![Logo „High-Low Divergence [Iridio Capital]”](https://cdn.ctrader.com/image/webp/443c4661-7abb-40f1-842f-4b6ec560649b_40914)


Cena
Od 14/04/2025
1
Sprzedaż