
Opis
Market Cipher A to zaawansowany wskaźnik techniczny zaprojektowany do łatwej analizy, identyfikacji i prognozowania makrotrendów na rynku kryptowalut.
Struktura i składniki
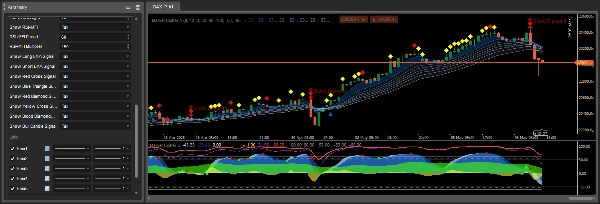
Market Cipher A składa się z wstęgi 8 wykładniczych średnich kroczących (EMA), które zmieniają kolor w zależności od trendu rynkowego. Wstęga EMA zmienia kolor na niebieski lub biały podczas rynku byka oraz na szary podczas rynku niedźwiedzia.
Domyślnie używane są średnie kroczące z wartościami EMA od 5 do 34. Przecięcia tych linii mogą być bardzo silnymi wskaźnikami opóźnionymi, dlatego Market Cipher A został zaprogramowany tak, aby automatycznie wyświetlać symbole odpowiadające różnym sygnałom, eliminując potrzebę ręcznej interpretacji każdego byczego lub niedźwiedziego przecięcia.
Symbole i sygnały handlowe
Market Cipher A wyświetla charakterystyczne symbole bezpośrednio na wykresie świecowym, które wskazują potencjalne okazje handlowe:
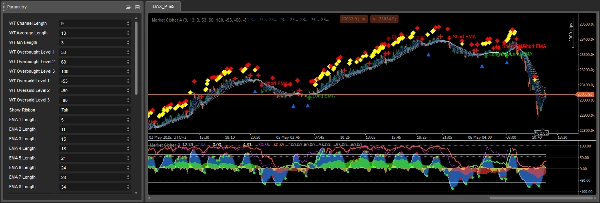
Niebieski trójkąt - sygnał odwrócenia trendu, wskazuje na spadającą dynamikę i nadchodzące odwrócenie. To wczesne ostrzeżenie, że momentum trendu maleje.
Zielone koło - wskaźnik byczy, najbardziej wiarygodny na interwałach 6-godzinnych i wyższych. Zazwyczaj pojawia się po niebieskim trójkącie i powinien być interpretowany w zakresie 1-3 świec.
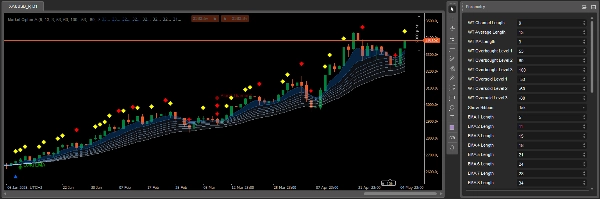
Żółte diamenty - wskazują kontynuację trendu wzrostowego. Powinny być używane razem z wstęgą EMA dla lepszego potwierdzenia kierunku trendu.
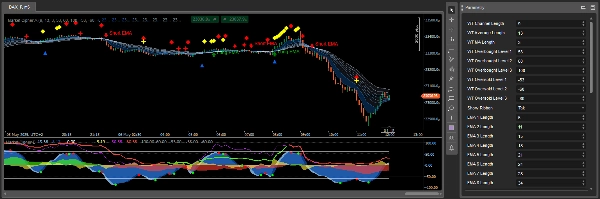
Czerwone diamenty - sygnalizują osłabienie trendu i możliwą kontynuację spadkową. Wskazują na wzrost dynamiki spadkowej.
Czerwony X - wskaźnik niedźwiedzi, najbardziej skuteczny na interwałach 1-godzinnych i wyższych. Powinien być używany razem z wstęgą EMA i czerwonym diamentem.
Żółty X - wskazuje manipulację rynkową, szczególnie duże zamykanie pozycji długich, które są szybko wykupowane i sprzedawane przez pozycje krótkie.
Duży czerwony diament (Blood Diamond) - najsilniejszy sygnał niedźwiedzi, wskazujący wysokie prawdopodobieństwo spadku, szczególnie gdy pojawia się razem z czerwonym X lub mniejszym czerwonym diamentem.
Zasady użytkowania
Market Cipher A zapewnia silne matematyczne wsparcie lub opór wizualnie, umożliwiając łatwe zrozumienie środowiska handlowego. Najlepiej działa z świecami Heiken Ashi.
Wstęga EMA nie tylko wskazuje trend, ale także działa jako dynamiczne poziomy wsparcia i oporu. Gdy wstęga jest niebieska/biała, a świece znajdują się powyżej niej, można szukać okazji do zajęcia pozycji długich. Gdy wstęga jest szara, a świece poniżej niej, można rozważyć pozycje krótkie.
Najlepsze wyniki osiąga się, gdy sygnały z Market Cipher A są łączone z innymi wskaźnikami z pakietu Market Cipher, szczególnie Market Cipher B, który dostarcza dodatkowych sygnałów momentum i punktów wejścia.
Szczegółowa interpretacja sygnałów w kontekście trendu
Ważnym aspektem Market Cipher A jest kontekstowa interpretacja sygnałów w zależności od dominującego trendu. Gdy wstęga zmienia kolor z szarego na niebieski, wskaźnik generuje zielone koło jako sygnał rozpoczęcia trendu wzrostowego. Zazwyczaj po zielonym kole, jeśli w następnych 1-3 świecach pojawi się żółty diament, prawdopodobieństwo wybicia jest wysokie. Jednak jeśli pojawią się czerwone diamenty, wybicie jest mniej prawdopodobne.
Podczas rynku byka żółte diamenty są korzystne, pokazując kontynuację wzrostu zgodną z trendem, podczas gdy czerwone diamenty reprezentują ruch przeciwny do trendu. Na rynku niedźwiedzia sytuacja jest odwrotna – czerwone diamenty są korzystne jako kontynuacja spadku, a żółte diamenty wskazują tymczasowy ruch wzrostowy przeciwny do trendu.
Czerwony X jest najbardziej wiarygodny, gdy pojawia się po czerwonym diamencie, a wstęga EMA jest niemal całkowicie ściśnięta, zmieniając kolor na niedźwiedzi szary. Dokładność tego wskaźnika zależy od interwału czasowego.
Mechanizm działania i geneza sygnałów
Symbole i sygnały w Market Cipher A są generowane na podstawie kilku źródeł: przecięć fal WaveTrend, poziomów wykupienia i wyprzedania oraz na podstawie RSI i MFI, gdy przekraczają linię środkową lub osiągają warunki wykupienia i wyprzedania. Ta wielowymiarowa analiza sprawia, że sygnały są bardziej kompleksowe niż pojedyncze wskaźniki.
Wstęga EMA składa się z 8 średnich kroczących, które tworzą charakterystyczną wstęgę z rozdzieleniem między poszczególnymi pasmami. Rozdzielenie pasm jest ważnym czynnikiem – szerokie rozdzielenie wskazuje na silny trend, podczas gdy ściśnięte pasma sugerują osłabienie momentum lub konsolidację.
Praktyczne zastosowanie w strategiach handlowych
Market Cipher A został zaprojektowany przede wszystkim jako narzędzie do analizy trendów, dlatego najlepiej sprawdza się w strategiach podążających za trendem. Zaleca się używanie wstęgi razem z innymi wskaźnikami identyfikującymi trend, a następnie szukanie okazji handlowych podczas cofnięć cen.
Ważne jest, aby pamiętać, że te sygnały pomagają precyzować moment wejścia lub wyjścia z transakcji, ale nie powinny być używane samodzielnie do podejmowania decyzji handlowych. Potrzebne są dodatkowe potwierdzenia, zwłaszcza dla sygnałów odwrócenia, które pojawiają się podczas płaskich ruchów cen.
Podsumowanie
The indicator automatically displays distinct symbols on the price chart to signal potential trading opportunities:
- Blue Triangle: signals declining momentum and possible trend reversal.
- Green Circle: indicates a bullish trend start, most reliable on 6-hour timeframes and above.
- Yellow Diamonds: suggest continuation of an upward trend.
- Red Diamonds: indicate trend weakening and potential downward continuation.
- Red X: bearish signal effective on 1-hour timeframes and higher.
- Yellow X: points to market manipulation events.
- Large Red Diamond ("Blood Diamond"): strong bearish signal with high probability of decline.
Signals are generated using a combination of WaveTrend crossovers, RSI, and MFI indicators, providing multidimensional market analysis. Market Cipher A is optimized for use with Heiken Ashi candles and is best applied within trend-following strategies, ideally combined with other Market Cipher indicators for enhanced entry and momentum confirmation.
Opinie klientów
5 | 67 % | |
4 | 33 % | |
3 | 0 % | |
2 | 0 % | |
1 | 0 % |


