
Açıklama
Vitrin:
Market Cipher B, kripto paralardan hisse senetlerine ve dövize kadar finansal piyasalarda kendinden emin ticaret kararları vermenize yardımcı olmak için tasarlanmış güçlü ama kullanıcı dostu bir teknik analiz göstergesidir. İster yeni başlayan olun ister deneyimli bir tüccar, bu osilatör net alım ve satım sinyalleri sunar ve dalgalı piyasalarda kolayca gezinmeniz için size avantaj sağlar.
Neden Market Cipher B'yi Seçmelisiniz?
1. Net Alım ve Satım Sinyalleri Gösterge, okunması kolay sinyallerle optimal giriş ve çıkış noktalarını belirler. Yeşil noktalar alım fırsatlarını, kırmızı noktalar ise satma zamanını gösterir. Bu, derin teknik bilgiye sahip olmasanız bile herkesin hızlı ve kararlı hareket etmesini kolaylaştırır.
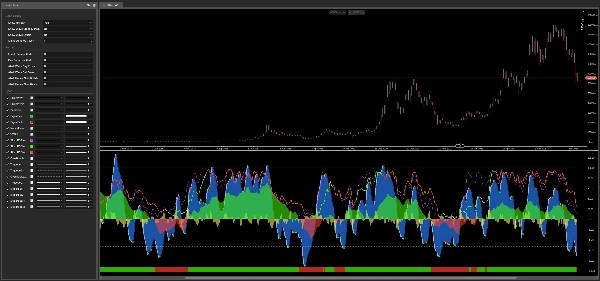
2. Mavi Dalgalar – Piyasa Momentumunu Bir Bakışta Görün Market Cipher B, piyasanın güç kazanıp kazanmadığını veya momentumunu kaybedip kaybetmediğini gösteren iki dinamik mavi dalga çizgisi kullanır. Bu çizgilerin kesişimleri, ortaya çıkan trendleri yakalamak veya potansiyel kayıplardan kaçınmak için önemli anları vurgular. Dalga sistemi, göstergenin temel motorunu oluşturur ve diğer tüm sinyaller için güvenilir bir temel sağlar.
3. Dalga Momentum Yayılımı – Yön Bulucunuz Sarı çizgi, iki mavi dalga arasındaki yayılımı temsil eder ve gerçek zamanlı bir momentum ölçer olarak görev yapar. Sıfırın üzerinde yükseldiğinde alıcılar kontrolü ele alır; sıfırın altına düştüğünde satıcılar hakim olur. Bu, bir trendin arkasında güç olup olmadığını veya tükenme ve potansiyel dönüşe yaklaşıp yaklaşmadığını anında belirlemenize yardımcı olur.
4. Para Akışı – Paranın Nereye Gittiğini Takip Edin Yeşil ve kırmızı Para Akışı çizgisi, yatırımcıların sermayelerini nereye yönlendirdiğini ortaya çıkarır. 60 periyot boyunca yumuşatılmış bir osilatör olarak hesaplanır ve kurumsal veya büyük ölçekli oyuncuların piyasaya girip çıktığını gösterir. Sıfır çizgisinin üzerindeki ve altındaki kesişimler özellikle önemlidir, genellikle büyük fiyat hareketlerinden önce gelir ve size anlamlı bir avantaj sağlar.
5. MFI Çubuğu – Anlık Sermaye Akışı Sinyali Göstergenin alt panelinde renk kodlu bir çubuk, mevcut Para Akışı yönünün hızlı bir görselleştirmesini sağlar. Yeşil çubuk boğa sermaye hakimiyetini, kırmızı çubuk ise ayı baskısını gösterir. Çubuktaki renk geçişleri, sayısal analiz gerektirmeden potansiyel trend dönüşlerini hemen vurgular – bu da göstergedeki en hızlı görsel ipuçlarından biridir.
6. Stokastik RSI – Hassas Zamanlama Mor Stokastik RSI çizgisi, yeşil ve kırmızı daha yavaş RSI çizgileriyle birlikte, aşırı alım (potansiyel olarak aşırı fiyatlanmış) veya aşırı satım (potansiyel olarak düşük değerli) piyasa koşullarını yüksek hassasiyetle tanımlamanıza yardımcı olur. Çift hız tasarımı – hızlı çizgi (40 periyot) ve yavaş çizgi (81 periyot) – kısa vadeli gürültü ile gerçek momentum değişimlerini ayırt etmenizi sağlar, bu da yüksek olasılıklı dönüş noktalarını bulmak ve yaygın piyasa tuzaklarından kaçınmak için idealdir.
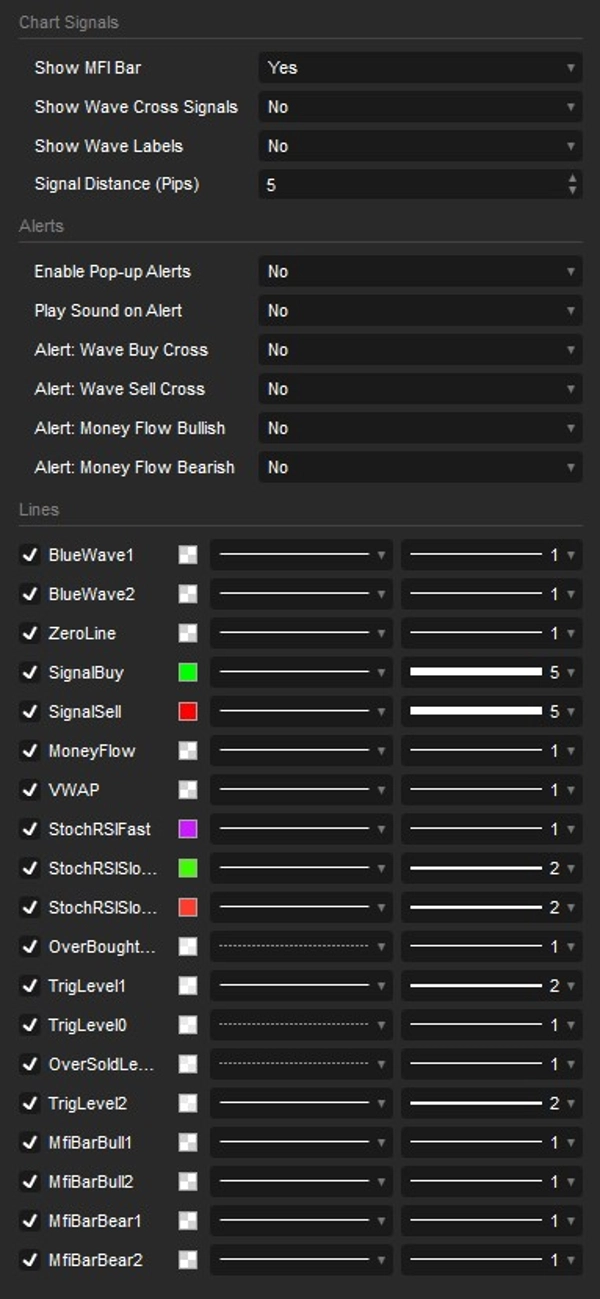
7. Akıllı Uyarı Sistemi – Hiçbir Sinyali Kaçırmayın Market Cipher B, ekrandan uzaktayken bile sizi bilgilendiren tamamen yapılandırılabilir bir bildirim sistemi içerir. Dört önemli olay için açılır uyarıları ve ses bildirimlerini bağımsız olarak etkinleştirebilir veya devre dışı bırakabilirsiniz: Dalga Alım Kesişimi, Dalga Satım Kesişimi, Para Akışı'nın sıfırın üzerine çıkması (Boğa) ve Para Akışı'nın sıfırın altına düşmesi (Ayı). Her uyarı türü ayrı ayrı açılıp kapatılabilir, böylece ticaret stratejiniz için en önemli olan üzerinde tam kontrol sahibi olursunuz.
8. Esneklik ve Özelleştirme Market Cipher B, cTrader'da mevcut olan herhangi bir piyasa ve zaman diliminde sorunsuz çalışır – bir dakikalık skalp grafiklerinden haftalık swing ticareti görünümlerine kadar. MFI Çubuğu, dalga kesişim sinyalleri, sinyal etiketleri (Fiyat grafiğinde doğrudan Al/Sat metni) ve tüm uyarı türleri dahil olmak üzere hangi bileşenlerin görüntüleneceği üzerinde tam kontrole sahipsiniz. Bu modülerlik, göstergenin görsel karmaşa olmadan tam ticaret stilinize uyacak şekilde uyarlanmasını sağlar.
Market Cipher B Kimler İçindir?
Yeni Tüccarlar sezgisel alım/satım sinyallerini, renk kodlu görselleri ve yıllarca teknik analiz deneyimi gerektirmeden ticarete başlamayı kolaylaştıran net referans seviyelerini takdir edeceklerdir. Gösterge sonuçlarını görsel olarak ilettiği için, sayıları okumaya daha az zaman harcar ve fırsatlara daha çok zaman ayırırsınız.
Deneyimli Yatırımcılar para akışı, dalga momentum yayılımı ve çift Stokastik RSI gibi gelişmiş bileşenlerde değer bulacaklar; bunlar birlikte, sofistike ve yüksek inançlı stratejiler için uygun çok katmanlı bir piyasa yapısı görünümü sağlar.
Günlük ve Swing Tüccarları göstergenin zaman dilimi esnekliğinden ve hızlı sinyal üretiminden faydalanır; böylece birden fazla araç arasında geçiş yapmadan hem hızlı günlük hareketlerden hem de uzun vadeli yön trendlerinden yararlanabilirler.
Özet
Additional components include a Money Flow line that tracks capital movement by large investors, accompanied by a color-coded Money Flow bar for quick visual cues on market pressure. A dual-speed Stochastic RSI helps identify overbought and oversold conditions, aiding in precise timing for potential reversals.
Market Cipher B supports full customization, allowing users to enable or disable specific features and alerts for key events such as wave crosses and Money Flow shifts. It operates on any timeframe, from minute charts to weekly views, making it suitable for new traders, experienced investors, day traders, and swing traders. The indicator integrates multiple analytical tools into one interface, aiming to provide a comprehensive market overview and assist in making informed trading decisions.
Müşteri değerlendirmeleri
5 | 67 % | |
4 | 33 % | |
3 | 0 % | |
2 | 0 % | |
1 | 0 % |


