MACD Indicator
อินดิเคเตอร์
เวอร์ชัน 1.0, Jun 2026
Windows, Mac
Trading product for MACD Indicator อินดิเคเตอร์ EMA SMA, image 2
Trading product for MACD Indicator อินดิเคเตอร์ EMA SMA, image 3
Trading product for MACD Indicator อินดิเคเตอร์ EMA SMA, image 4
Trading product for MACD Indicator อินดิเคเตอร์ EMA SMA, image 5
Trading product for MACD Indicator อินดิเคเตอร์ EMA SMA, image 6
87
การขาย
147
ติดตั้งฟรี

คำอธิบาย

โชว์เคส:


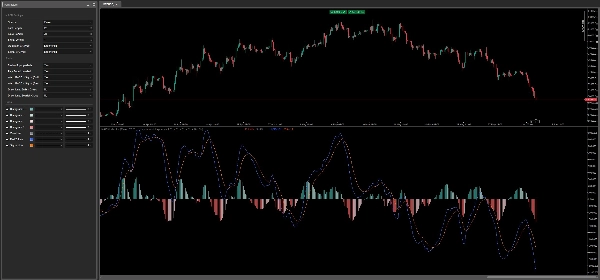
ตัวบ่งชี้ MACD เป็นเวอร์ชันที่ปรับปรุงและสวยงามของออสซิลเลเตอร์ Moving Average Convergence Divergence (MACD) แบบคลาสสิกสำหรับแพลตฟอร์ม cTrader สร้างขึ้นเพื่อเลียนแบบพฤติกรรมและรูปลักษณ์ของต้นฉบับ TradingView มอบประสบการณ์ระดับมืออาชีพที่คุ้นเคยพร้อมการอัปเกรดอัจฉริยะหลายอย่าง


ทำไมต้องเลือกตัวบ่งชี้ MACD?

1. ความเข้ากันได้ 100% กับ TradingView

อัลกอริทึมหลักใช้ตรรกะเดียวกันกับ MACD มาตรฐานบน TradingView โดยคำนวณเส้น MACD เป็นความแตกต่างระหว่างค่าเฉลี่ยเคลื่อนที่เร็วและช้า สร้างเส้นสัญญาณจากค่าเฉลี่ยเคลื่อนที่ที่สาม และแสดงฮิสโตแกรมเป็นความแตกต่างระหว่างสองเส้น ผลลัพธ์คือการจัดตำแหน่งที่แม่นยำกับแผนภูมิที่คุณคุ้นเคย

2. ฮิสโตแกรม 4 สีอัจฉริยะ

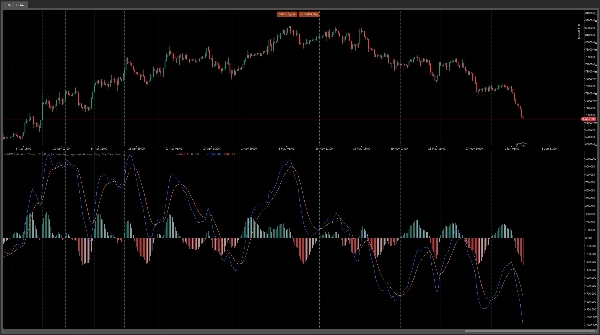
แทนที่จะเป็นฮิสโตแกรมสองสีธรรมดา ตัวบ่งชี้นี้ใช้ระบบไล่ระดับสีสี่สีแบบไดนามิกเหมือนกับการใช้งาน PineScript ของ TradingView:

- บวกแรง – แถบฮิสโตแกรมอยู่เหนือศูนย์ *และ* กำลังเพิ่มขึ้น

- บวกอ่อน – แถบฮิสโตแกรมอยู่เหนือศูนย์ *แต่* กำลังลดลง

- ลบอ่อน – แถบฮิสโตแกรมอยู่ต่ำกว่าศูนย์ *แต่* กำลังเพิ่มขึ้น

- ลบแรง – แถบฮิสโตแกรมอยู่ต่ำกว่าศูนย์ *และ* กำลังลดลง

ความฉลาดด้านสีนี้ช่วยให้คุณประเมินได้ทันทีว่าโมเมนตัมกำลังเร่งหรืออ่อนตัวลงโดยไม่ต้องตีความตัวเลขดิบ

3. ระบบแจ้งเตือนในตัวพร้อมป๊อปอัพและเสียง*

รับข้อมูลแม้เมื่อคุณไม่อยู่หน้าจอ ตัวบ่งชี้สามารถส่งการแจ้งเตือนป๊อปอัพในตัวของ cTrader และเล่นเสียงที่แตกต่างกันเมื่อ:

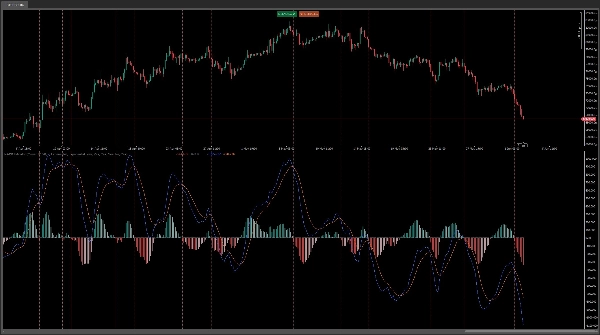
- เส้น MACD ตัดขึ้นเหนือเส้นสัญญาณ (สัญญาณซื้อ – Bullish Cross)

- เส้น MACD ตัดลงใต้เส้นสัญญาณ (สัญญาณขาย – Bearish Cross)

แต่ละประเภทการแจ้งเตือนสามารถเปิดปิดได้อย่างอิสระ และระบบป้องกันการแจ้งเตือนซ้ำบนแท่งเดียวกัน

4. สัญญาณภาพที่ปรับแต่งได้

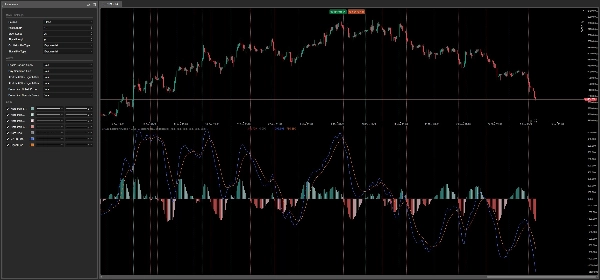
คุณสามารถเลือกวาดเส้นแนวตั้งประแบบจุดบนแผนภูมิทุกครั้งที่เกิดการตัดขึ้นหรือตัดลง ซึ่งช่วยให้สแกนแผนภูมิย้อนหลังและระบุโซนสัญญาณที่ผ่านมาได้ง่ายโดยไม่ต้องเลื่อนดูข้อมูลด้วยตนเอง

5. ปรับแต่งได้เต็มที่และยืดหยุ่น

ปรับแต่งทุกแง่มุมของตัวบ่งชี้ให้ตรงกับสไตล์การเทรดของคุณ:

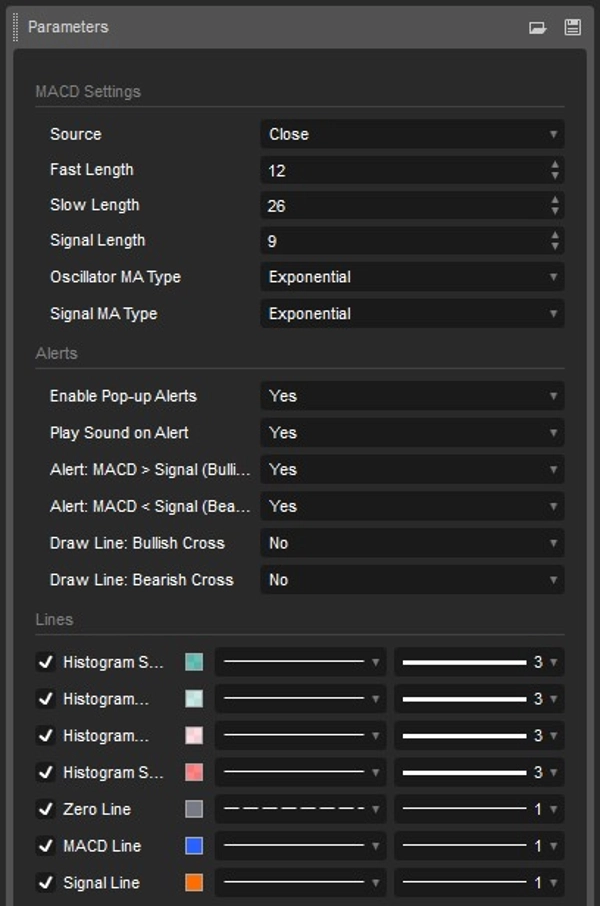
- ความยาวเร็ว – ช่วงเวลาสำหรับค่าเฉลี่ยเคลื่อนที่เร็ว

- ความยาวช้า – ช่วงเวลาสำหรับค่าเฉลี่ยเคลื่อนที่ช้า

- ความยาวสัญญาณ – ช่วงเวลาสำหรับค่าเฉลี่ยเคลื่อนที่เส้นสัญญาณ

- ประเภท MA ของออสซิลเลเตอร์ – เลือกประเภทค่าเฉลี่ยเคลื่อนที่ใดก็ได้ (EMA, SMA, ฯลฯ) สำหรับการคำนวณ MACD

- ประเภท MA ของสัญญาณ – เลือกประเภท MA สำหรับเส้นสัญญาณอย่างอิสระ


ตัวบ่งชี้นี้เหมาะกับใคร?

ผู้ใช้พาวเวอร์ยูสเซอร์ของ TradingView ที่ต้องการ MACD ที่เป็นเนทีฟของ cTrader ซึ่งมีพฤติกรรม การคำนวณ และสีเหมือนต้นฉบับ – ไม่มีความประหลาดใจ ไม่มีความไม่ตรงกัน

เทรดเดอร์แบบดิสคริสชันนารีที่ต้องการการแจ้งเตือนการตัดกันแบบเรียลไทม์ที่ชัดเจนพร้อมการแจ้งเตือนป๊อปอัพและเสียง ช่วยให้จับจังหวะเข้าเทรดได้ง่ายโดยไม่ต้องจ้องหน้าจอตลอดวัน

เทรดเดอร์เชิงวิเคราะห์ที่ชื่นชอบฮิสโตแกรมสี่สีเป็นเครื่องมือวินิจฉัยโมเมนตัม – ระบุได้อย่างรวดเร็วว่าความกดดันขาขึ้นหรือลงกำลังเพิ่มหรือลดความแรง

ทุกระดับประสบการณ์ – MACD เป็นออสซิลเลเตอร์พื้นฐาน และการใช้งานนี้ทำให้เข้าถึงได้ง่ายขึ้นกว่าที่เคยด้วยภาพที่สะอาด การเข้ารหัสสีอัจฉริยะ และระบบแจ้งเตือนที่ปรับแต่งได้เต็มที่


cGuru

สรุป

สรุปโดย AI
The MACD Indicator for cTrader is a precise implementation of the classic Moving Average Convergence Divergence oscillator, designed to replicate TradingView’s original behavior and appearance. It calculates the MACD line as the difference between fast and slow moving averages, derives a signal line from a third moving average, and displays a histogram representing their difference. The histogram uses a four-color gradient to indicate momentum strength and direction: strong positive, weak positive, weak negative, and strong negative, enabling quick visual assessment of momentum changes.
This indicator includes a built-in alert system with customizable pop-up and sound notifications for bullish and bearish MACD-signal line crossovers, with options to toggle alerts independently and prevent duplicates. Users can also enable vertical dotted lines on the chart to mark crossover events for easier historical analysis.
All parameters are fully customizable, including the periods for fast, slow, and signal moving averages, as well as the types of moving averages used (EMA, SMA, etc.). The indicator supports signals for crossovers and trend strength, and requires bar or tick data input. It is suitable for traders seeking a TradingView-compatible MACD with enhanced visual cues and real-time alerts on the cTrader platform.

โปรไฟล์อินดิเคเตอร์
หมวดหมู่อินดิเคเตอร์
Trend
ประเภทเอาต์พุต
สัญญาณ
ตัวกรอง
การแสดงเป็นภาพ
ข้อกำหนดด้านข้อมูล
แท่งเท่านั้น
ข้อมูล Tick
สัญญาณที่รองรับ
Cross
ความแข็งแกร่งของแนวโน้ม

รีวิวจากลูกค้า

0.0
รีวิว: 0
รีวิวจากลูกค้า
ยังไม่มีรีวิวสำหรับผลิตภัณฑ์นี้ หากเคยลองแล้ว ขอเชิญมาเป็นคนแรกที่บอกคนอื่น!

การสนทนา

คำถามที่พบบ่อย

EMA
SMA
Key Levels
MACD
Moving Average
ผลิตภัณฑ์ที่มีให้บริการผ่าน cTrader Store รวมถึงบอทการเทรด อินดิเคเตอร์ และปลั๊กอิน มีให้บริการโดยนักพัฒนาบุคคลที่สามและมีไว้เพื่อวัตถุประสงค์ในการเข้าถึงข้อมูลและทางเทคนิคเท่านั้น cTrader Store ไม่ใช่โบรกเกอร์และไม่ได้ให้คำแนะนำการลงทุน คำแนะนำส่วนบุคคล หรือการรับประกันผลการดำเนินงานในอนาคต

เพิ่มเติมจากผู้เขียนคนนี้

อินดิเคเตอร์
AI
ATR
+27
Trend Is Your Friend cBot - INDICATOR - Professional Grid, Pyramid, Swing & Scalp Trading Indicator
"Supertrend Indicator v1.1" โลโก้
ยอดนิยม
4.3
(3)
$19
/
$30
อินดิเคเตอร์
AI
ATR
+27
Supertrend Indicator
"Nadaraya-Watson Indicator" โลโก้
ยอดนิยม
5.0
(2)
$19
/
$30
อินดิเคเตอร์
AI
ATR
+27
Nadaraya-Watson Envelope Indicator
"Market Cipher B" โลโก้
ยอดนิยม
4.6
(3)
$30
/
$50
อินดิเคเตอร์
AI
ATR
+27
Market Cipher B
"Supertrend Indicator" โลโก้
ยอดนิยม
4.6
(3)
$19
/
$30
อินดิเคเตอร์
AI
ATR
+27
Supertrend Indicator
อินดิเคเตอร์
AI
ATR
+26
MacD Custom Indicator-Multiple Time Frame
"Market Cipher A" โลโก้
ยอดนิยม
4.6
(3)
$30
/
$50
อินดิเคเตอร์
AI
ATR
+19
Market Cipher A
"RSI Simple Grid cBot" โลโก้
ยอดนิยม
5.0
(2)
$39
cBot
AI
ATR
+27
RSI Simple Grid cBot - grid trading strategy with RSI (Relative Strength Index) signals
26.8%
ROI
4.41
อัตราส่วน กำไรต่อขาดทุน
cBot
AI
ATR
+27
SmartHedge cBot - Your Trading Companion
1.26
อัตราส่วน กำไรต่อขาดทุน
cBot
ATR
RSI
+5
Trend is your friend cBot - Professional Grid, Pyramid, Swing & Scalp Trading System
28%
ROI
5.27
อัตราส่วน กำไรต่อขาดทุน
อินดิเคเตอร์
RSI
SMA
+1
TradingView RSI replica for cTrader with dynamic gradients, automatic divergence detection, and alerts.

นอกจากนี้คุณยังอาจชอบ

อินดิเคเตอร์
Prop
Forex
+13
Supertrend - Multi-Timeframe Indicator
อินดิเคเตอร์
Prop
Forex
+11
Customize your Moving Average! Choose any timeframe and price source for precision and flexibility in your analysis.
"overbought oversold" โลโก้
ยอดนิยม
5.0
(2)
$19
/
$29
อินดิเคเตอร์
AI
ATR
+27
Overbought Oversold Indicator
อินดิเคเตอร์
SMC
Prop
+8
KILLZONES AND MACRO SESSIONS
อินดิเคเตอร์
AI-assisted
Order Block
+5
The daily bias estimator indicator uses ICT concepts to show whether the chart is bullish or bearish on multi-time frame
อินดิเคเตอร์
RSI
MACD
+7
The ZigZag indicator is a technical analysis tool primarily used to identify key price reversal points.
อินดิเคเตอร์
Prop
Forex
+4
Fractals is a precision-engineered trading indicator for cTrader that reveals the hidden architecture of price action.
อินดิเคเตอร์
RSI
Breakout
+1
🚀 TrendHeikinMultiMA: Advanced trend detection using Heikin-Ashi smoothing & MAs! Eliminates noise, confirms real trend
อินดิเคเตอร์
Prop
Forex
+12
⚡ ADXVMA Aurora Trend Filter combines ADX trend strength with an adaptive EMA blend ⚡
อินดิเคเตอร์
VWAP
Volume
+3
Don't trust static support and resistance levels, this indicator combines Fibonacci and VWAP in one powerful tool.
อินดิเคเตอร์
AI
SMC
+9
Identifies market trends (-10 to +10) using HMA with volume confirmation. Includes customizable alerts.
อินดิเคเตอร์
Prop
Forex
+4
Draws pivots (P, S/R, CPR) from selected anchors like H1–Month1, with optional mid-levels (PS1, S1S2, etc.)
อินดิเคเตอร์
A compact, visual multi-timeframe trend indicator for cTrader. Easily spot bullish or bearish trends across 4 customizab
"Buy and sell indicator" โลโก้
ยอดนิยม
4.3
(3)
$19
/
$29
อินดิเคเตอร์
AI
ATR
+20
Buy and Sell Signals
อินดิเคเตอร์
MSS
Key Levels
+2
Maps equal highs, equal lows and active liquidity pools directly on your cTrader chart.
"Supertrend" โลโก้
ยอดนิยม
4.3
(3)
$19
อินดิเคเตอร์
ATR
RSI
+6
💹 Define a price channel 📈 and determine trend direction (bullish 🟢 or bearish 🔴).
อินดิเคเตอร์
Volume
Key Levels
+1
Order book indicator .Don't trade against the flow. Trade with the truth!
อินดิเคเตอร์
ATR
BOS
+3
Fair Value Gaps with Multi-Timeframe.

ราคา

87
การขาย
147
ติดตั้งฟรี