
Açıklama
🔧 ATR_RR_SignalPanel — Teknik & Detaylı Açıklama (EN) 🧠📈
ATR_RR_SignalPanel, cTrader için bindirme göstergesi olup trend değişim giriş sinyalleri üretir ve bunu Hızlı EMA vs Yavaş EMA rejimi kullanarak yapar, ardından tam bir sanal işlem çerçevesi oluşturur (Giriş 🏁, Zarar Durdur 🛑, Nihai Kar Al 🎯, Ara Hedefler 🟢) ve bunu ATR tabanlı risk boyutlandırması ve yapılandırılabilir bir Risk:Ödül çarpanı ⚖️ ile yapar.
🧭 Temel Mantık (Sinyal Motoru) 🚦
- Gösterge şunları hesaplar:
-
- Hızlı EMA ⚡ ve Yavaş EMA 🐢 Kapanış üzerinde.
- ATR (Wilder yumuşatma) 🌡️ volatilite tabanlı stop mesafesi için.
- Bir trend rejimi şu şekilde tanımlanır:
-
- Boğa trendi 🟢 olduğunda
Hızlı EMA > Yavaş EMA - Ayı trendi 🔴 olduğunda
Hızlı EMA < Yavaş EMA
- Boğa trendi 🟢 olduğunda
- Bir Trend Değişimi 🔁, boğa/ayı durumu önceki bardan farklı olduğunda tetiklenir (Pine’daki
bullTrend != bullTrend[1]eşdeğeri).
🎯 Giriş Koşulları (ALIŞ/SATIŞ) 🟩🟥
Bir trend değişikliği gerçekleştiğinde:
- ALIŞ sinyali 🟢 eğer:
-
- Boğa trendi aktif ve bir trend değişikliği tespit edilir
- İsteğe bağlı mum onayı ✅: Kapanış > Açılış (boğa mumu)
- SATIŞ sinyali 🔴 eğer:
-
- Ayı trendi aktif ve bir trend değişikliği tespit edilir
- İsteğe bağlı mum onayı ✅: Kapanış < Açılış (ayı mumu)
🧪 Sanal Pozisyon Yönetimi (cBot Değil) 🧩
Bu gösterge sipariş vermez. Bunun yerine dahili bir “sanal pozisyon” simüle eder:
- Yeni bir ALIŞ/SATIŞ sinyalinde şunları ayarlar:
-
- Giriş Fiyatı = mevcut kapanış 🏁
- Zarar Durdur = mum ekstremi ± ATR × çarpan 🛑
- Nihai Kar Al = Giriş ± (Risk × RiskÖdül) 🎯
- Ara Kar Al seviyeleri = 1R, 2R, … floor(RR)-1 seviyelerinde adımlar 🟢
- Fiyat hareketini bar bazında izler:
-
- Eğer Nihai Kar Al tetiklenirse ➜ işaretler 🎯 ve sanal pozisyonu kapatır ✅
- Eğer Zarar Durdur tetiklenirse ➜ işaretler 🛑 ve sanal pozisyonu kapatır ❌
- Ara Kar Al tetiklemeleri sadece bir kez takip edilir 🧷
🔁 Geçersiz Kılma Mantığı (Aktifken Karşı Sinyal) ⚠️
Eğer zıt yönde bir sanal işlem varken yeni bir sinyal gelirse:
- Önceki giriş GEÇERSİZ KILINMIŞ olarak işaretlenir ⚠️ (GEÇERSİZ ALIŞ / GEÇERSİZ SATIŞ)
- Önceki sanal pozisyon sonlandırılır 🧯
- Yeni yönde yeni bir sanal pozisyon oluşturulur 🔄
🧼 Çoklu Örnek Güvenliği (Aynı Grafikte Birden Fazla Kopya) 🧩🧩
Her gösterge örneği benzersiz bir dahili ID 🆔 üretir, böylece:
- Bir örnekten gelen çizgiler/metinler başka bir örneğin üzerine yazmaz ✅
- Birden fazla yapılandırmayı paralel çalıştırabilirsiniz (örneğin, scalping + swing) 🧠📊
🧯 Karmaşıklık Kontrolleri (İşaretçi Sınırı) 🧹✨
Grafikleri okunabilir tutmak için şunları yapabilir:
- Çizilen metin işaretçi sayısını sınırlar (ALIŞ/SATIŞ/KAR AL/ZARAR DURDUR/GEÇERSİZ/KAR AL1…) 🧾
- Limit aşıldığında eski işaretçileri otomatik siler ♻️
🧷 İsteğe Bağlı “Son Risk Çizgilerini Tut” 🧠📌
Etkinleştirildiğinde, son Giriş/Zarar Durdur/Kar Al çizgileri Kar Al/Zarar Durdur kapandıktan sonra bile görünür kalır:
- İşlem sonrası inceleme için harika 🧑🔬
- Günlük tutmak için mükemmel 📒✅
⚙️ Parametreler — Detaylı Açıklama (EN) 🔍📌
📈 Sinyal & Risk Temeli
⚡ Hızlı EMA
- Ne yapar 🧠: Rejim değişikliklerini tespit etmek için kullanılan hızlı EMA periyodunu ayarlar.
- Etkisi 📊: Düşük değerler = daha tepkisel ➜ daha fazla sinyal; yüksek = daha yumuşak ➜ daha az sinyal.
- Tipik aralıklar 🎛️: Hızlı piyasalar için 3–10 ⚡, daha sakin ayarlar için 10–20 🐢
🐢 Yavaş EMA
- Ne yapar 🧠: Trendin temel çizgisi olarak kullanılan yavaş EMA periyodunu ayarlar.
- Etkisi 📊: Daha yüksek yavaş EMA = daha güçlü filtreleme ➜ daha az trend değişim tetikleyicisi.
- Tipik aralıklar 🎛️: Tarza bağlı olarak 13–55 🧭
🌡️ ATR Periyodu
- Ne yapar 🧠: ATR için volatilite ölçüm uzunluğunu kontrol eder.
- Etkisi 📏: Kısa ATR hızlı tepki verir (daha sıkı ZD), uzun ATR stabil olur (daha dengeli ZD).
- Tipik aralıklar 🎛️: 10–21 yaygındır ✅
🛑 ZD Çarpanı (ATR)
- Ne yapar 🧠: Zarar Durdur mesafesini ATR birimleri cinsinden tanımlar.
- Uzun 🟢:
ZD = Düşük - ATR * Çarpan - Kısa 🔴:
ZD = Yüksek + ATR * Çarpan - Etkisi 🎯: Daha yüksek çarpan = daha geniş ZD (daha az durdurma, daha büyük risk); daha düşük = daha sıkı ZD (daha fazla durdurma).
- Tipik değerler 🎛️: Volatiliteye bağlı olarak 0.3–2.0 arası 🌪️
⚖️ Risk:Ödül (R:R)
- Ne yapar 🧠: Nihai Kar Al hesaplamak için “risk” mesafesini çarpar.
- Formül 📌:
-
- Risk = |Giriş − ZD|
- Nihai KA = Giriş ± Risk × RÖ 🎯
- Ara KAlar 🟢: TP1 1R’de, TP2 2R’de, … kadar
floor(RR)-1 - Örnek 🧪: RÖ=3 ➜ TP1 (1R), TP2 (2R), Nihai TP (3R) 🎯🎯🎯
✅ Mum onayı gerektir
- Ne yapar 🧠: Sinyal barında mum yönü doğrulaması ekler.
- ALIŞ 🟢: Kapanış > Açılış gerektirir
- SATIŞ 🔴: Kapanış < Açılış gerektirir
- Etkisi 🧽: Zayıf dönüşleri filtreler, gürültüyü azaltır, giriş gecikebilir ⏳
📌 EMA’ların Gösterimi
👁️ Hızlı EMA’yı Göster
- Ne yapar 🧠: Hızlı EMA çizgisini gösterir/gizler.
- Kullanım durumu 💡: Temiz bir grafik istiyorsanız gizleyin 🧼
👁️ Yavaş EMA’yı Göster
- Ne yapar 🧠: Yavaş EMA çizgisini gösterir/gizler.
- Kullanım durumu 💡: Trend bağlamı için görünür tutun 🧭
🎛️ Görsel Kontroller (Karmaşıklık Yönetimi) 🧹✨
🚦 Sinyalleri Göster
- Ne yapar 🧠: ALIŞ/SATIŞ işaretçilerini gösterir/gizler.
- İçerir 🧷: Sadece ALIŞ 🟢 / SATIŞ 🔴 işaretçileri
- İpucu 💡: “Sadece çizgiler” modu için devre dışı bırakın 📏
🏷️ Kar Al Etiketlerini Göster
- Ne yapar 🧠: TP1, TP2 gibi etiketleri gösterir/gizler.
- Etkisi 🧼: Kapalıysa yüksek zaman dilimlerinde çok fazla metin gürültüsünü kaldırır 📉
- Not 🧷: Etiketler her TP tetiklenmesinde sadece bir kez görünür ✅
⚠️ Geçersiz Kılma İşaretlerini Göster
- Ne yapar 🧠: GEÇERSİZ ALIŞ / GEÇERSİZ SATIŞ işaretçilerini gösterir/gizler.
- Kullanım durumu 🧠: Sinyal dönüşlerini incelemek istediğinizde faydalıdır 🔁
🎯🛑 Nihai KA/ZD İşaretlerini Göster
- Ne yapar 🧠: Nihai KA ve ZD işaretçilerini gösterir/gizler.
- Kullanım durumu 📒: Sonuç dağılımını incelemek için harika 🎲
📏 Risk Çizgilerini Göster (Giriş/ZD/KA)
- Ne yapar 🧠: Grafikte Giriş 🏁, ZD 🛑, Nihai KA 🎯 çizgilerini çizer.
- Etkisi 📌: Sanal işlem yapısını anında görselleştirir 🧠
🟢 Ara KA Çizgilerini Göster
- Ne yapar 🧠: TP1/TP2/... seviyeleri için noktalı çizgiler çizer.
- İpucu 🧼: Grafik çok “yeşil spagetti” olursa devre dışı bırakın 🍝🟢
📌 Son Risk Çizgilerini Tut
- Ne yapar 🧠: Sanal çıkıştan (KA/ZD) sonra son Giriş/ZD/KA çizgilerini görünür tutar.
- Neden faydalı 📒: Günlük tutma ve işlem sonrası analiz için mükemmel 🧑🔬✅
🧾 Grafikte Maksimum İşaretçi (0=limitsiz)
- Ne yapar 🧠: Gösterge tarafından grafikte bırakılan metin nesnelerinin sayısını sınırlar.
- Nasıl çalışır ♻️: Limit aşıldığında en eski işaretçiler otomatik olarak kaldırılır.
- Önerilen 🎛️: Zaman dilimi ve geçmiş derinliğine bağlı olarak 80–200 arası 🕰️
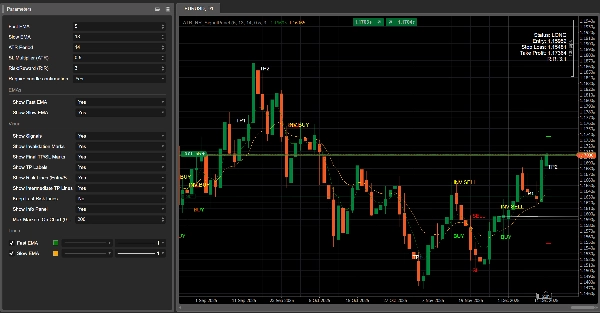
🧾 Bilgi Panelini Göster
- Ne yapar 🧠: Grafikte kompakt bir durum paneli gösterir.
- Gösterir 📋: Durum (UZUN/KISA/Pozisyon Yok), Giriş, ZD, KA, hesaplanan RÖ.
Özet
The indicator simulates virtual trades by setting entry price, stop loss, and take profit levels using Average True Range (ATR) for volatility-based risk sizing combined with a configurable risk-to-reward multiplier. It tracks intermediate take profit levels and monitors price action bar-by-bar to mark virtual trade outcomes without placing actual orders.
Key features include optional candle confirmation for signals, multi-instance support to run multiple configurations on the same chart, and visual clutter controls such as limiting markers and toggling display of EMAs, signals, and risk lines. An info panel provides a compact status overview of virtual positions. Parameters allow customization of EMA periods, ATR period, stop loss multiplier, and risk-reward ratio to adapt to different trading styles and market conditions.
Supported markets include Forex, indices, commodities, stocks, and cryptocurrencies, with symbols like GBPUSD, EURUSD, XAUUSD, NAS100, and BTCUSD among the tagged assets.
Müşteri değerlendirmeleri
5 | 100 % | |
4 | 0 % | |
3 | 0 % | |
2 | 0 % | |
1 | 0 % |


