Description
Présentation du Marketplace (court)
Volume Delta & CVD — Lire le flux agressif en temps réel. Réinitialisations flexibles (Jour/Semaine/Mois), lissage EMA optionnel, et delta cumulatif non repeint. Parfait pour confirmer les cassures et repérer les divergences.
Volume Delta & CVD — Guide d'examen et des paramètres
Slogan : Mesurez le déséquilibre achat/vente (Delta) et son flux cumulatif (CVD) avec des réinitialisations flexibles. Non repeint.
Présentation générale
Volume Delta & CVD pour cTrader calcule, par barre, le Delta (achats agressifs vs ventes) et le CVD (Delta de volume cumulatif). Il vous aide à lire la pression du flux d'ordres, confirmer les cassures et repérer les divergences par rapport au prix.
Note : L'indicateur utilise TickVolume (standard cTrader) comme proxy de volume.
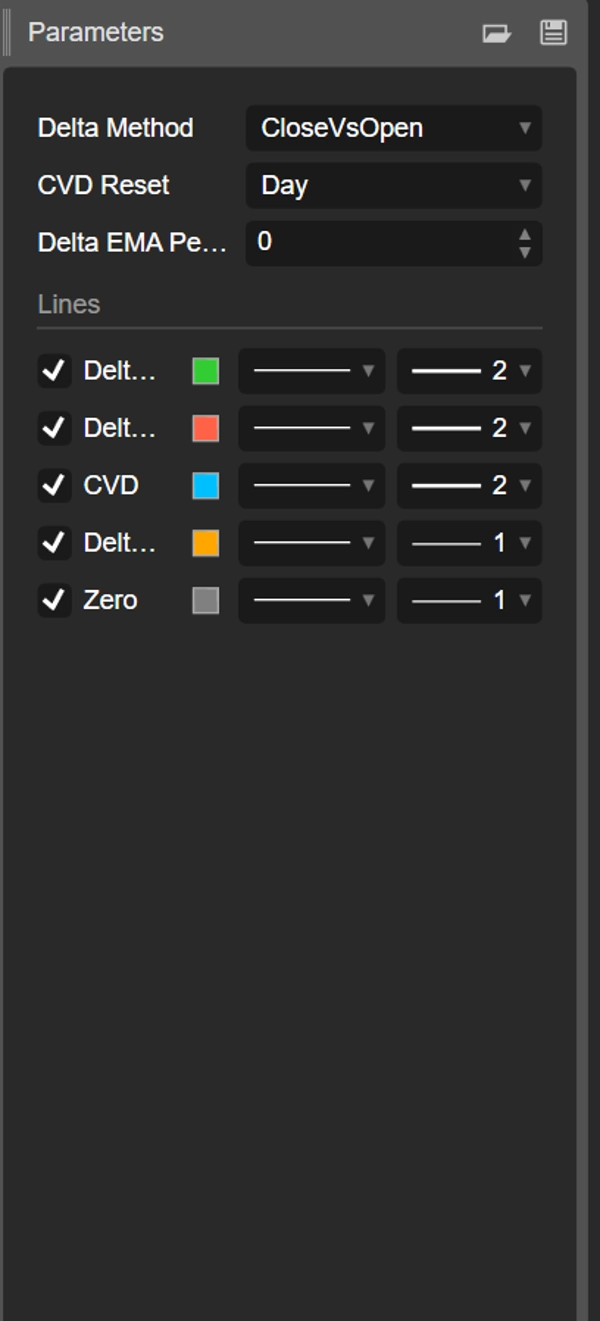
Paramètres (détaillés)
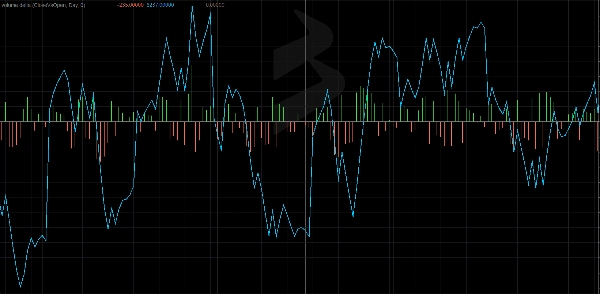
Méthode Delta
Choisissez comment le flux directionnel de la barre est estimé :
- CloseVsPrevClose
Delta = ±TickVolume selon Close[t] vs Close[t-1].
Avantages : très réactif ; idéal pour les changements de régime intrajournaliers. - CloseVsOpen
Delta = ±TickVolume selon Close vs Open de la même barre.
Avantages : met en évidence les barres directionnelles ; réduit le bruit inter-barres. - Multiplicateur de flux monétaire (MFM)
MFM = ((Close−Low) − (High−Close)) / (High−Low)dans [−1, +1]
Delta = MFM × TickVolume
Avantages : pondération intra-barre ; lisse/robuste lorsque les plages sont larges.
Réinitialisation CVD
Contrôle quand le compteur cumulatif redémarre :
- Aucune : continue depuis le début du graphique.
- Jour : réinitialise à chaque nouveau jour (biais intrajournalier).
- Semaine : réinitialise à chaque nouvelle semaine (swing).
- Mois : réinitialise à chaque nouveau mois (biais de timeframe supérieur).
Période EMA Delta (0 = désactivé)
- Applique une EMA au Delta pour lisser l'histogramme et révéler les changements de régime.
- Suggestions : 5–9 scalping, 10–21 intraday, 21–34 swing.
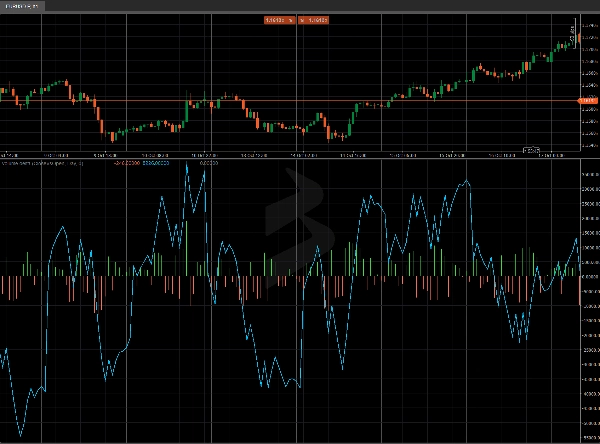
Sorties / Tampons
- Delta Up (histogramme vert) : portion positive du Delta.
- Delta Down (histogramme rouge) : portion négative du Delta.
- CVD (ligne aqua) : somme cumulative du Delta avec la réinitialisation choisie.
- Delta EMA (ligne orange, optionnelle) : Delta lissé.
- Zéro (ligne grise) : base pour comparaison rapide.
Comment le lire
- Delta > 0 → domination des achats agressifs dans la barre.
- Delta < 0 → domination des ventes agressives dans la barre.
- CVD en hausse → accumulation ; CVD en baisse → distribution.
- Divergences
-
- Le prix fait des plus hauts plus hauts tandis que le CVD ne confirme pas → possible épuisement de la pression d'achat.
- Le prix fait des plus bas plus bas tandis que le CVD ne confirme pas → possible épuisement de la pression de vente.
Stratégies pratiques
- Confirmation de cassure : privilégiez les cassures à la hausse lorsque le CVD s'accélère et que le Delta EMA devient positif.
- Atténuation des extensions : recherchez des divergences prix vs CVD à des niveaux clés (VWAP/VWAP ancré, S/R).
- Biais de session : avec Réinitialisation CVD = Jour, lisez la direction intrajournalière dominante.
Démarrage rapide
- Ajoutez l'indicateur.
- Commencez avec Méthode Delta = MFM, Réinitialisation CVD = Jour, EMA = 10 (intraday).
- Sur des graphiques bruyants, augmentez l'EMA ou passez à CloseVsOpen.
- Cherchez la confluence avec VWAP ancré, S/R statique/dynamique, ou des configurations de price-action.
Performance & Compatibilité
- APIs modernes (
Bars.*,LineColor). - Calculs non repeints.
- Fonctionne sur tout symbole et timeframe.
Résumé
The indicator supports three Delta calculation methods: CloseVsPrevClose (responsive for intraday shifts), CloseVsOpen (reduces noise by focusing on directional bars), and Money Flow Multiplier (MFM) which weights intra-bar volume for smoother results. An optional Exponential Moving Average (EMA) smoothing can be applied to Delta to highlight regime changes.
Outputs include separate histograms for positive and negative Delta, the CVD line, an optional Delta EMA line, and a zero baseline for reference. Traders can use the indicator to confirm breakouts, identify divergences between price and volume flow, and assess order-flow pressure. It works on any symbol and timeframe, supporting markets such as Forex, indices, commodities, stocks, and cryptocurrencies.


![Logo de "[Stellar Strategies] Market Session Ultimate"](https://cdn.ctrader.com/image/webp/61ffd537-0125-4246-9e72-42eca1791d64_28232)