
Açıklama
🚀Fiyat Projeksiyonu Salınım Hacmi: 📈
https://chartshots.spotware.com/c/6980f0f0287fb
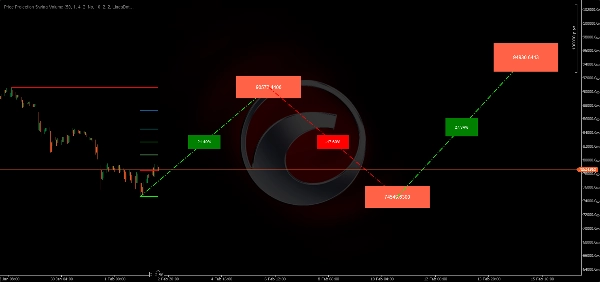
Fiyat Projeksiyonu Salınım Hacmi, son fiyat salınımlarına ve Fibonacci harmonik oranlarına dayanarak bir varlığın en olası gelecekteki yolunu haritalamak için tasarlanmış gelişmiş bir tahmin aracıdır. Mevcut piyasa aralığını belirler ve potansiyel fiyat hareketi için çok aşamalı bir "yol haritası" projekte eder.
🔍 Piyasa Analizi ve Koşulları
https://chartshots.spotware.com/c/6980f104dab21
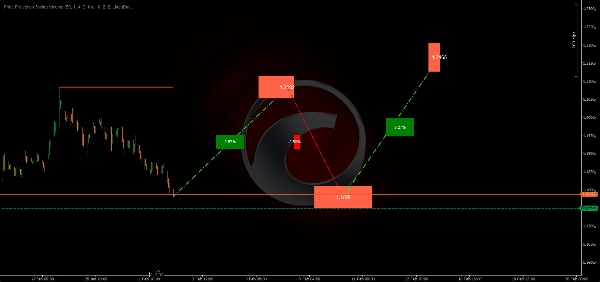
Bu algoritma, "Piyasa Zarfı"nı analiz ederek tanımlamaya odaklanır:
- Aşırı Salınım Noktaları: Belirli bir Geriye Dönük Dönem (örneğin, son 50 bar) taranarak mutlak En Yüksek Yüksek ve En Düşük Düşük bulunur.
- Düzeltme Bölgeleri: Mevcut salınım içinde beş ana Fibonacci seviyesi (23.6%, 38.2%, 50%, 61.8% ve 78.6%) otomatik olarak hesaplanır ve çizilir, ilgi alanlarını belirlemek için.
- Harmonik Projeksiyonlar: Projeksiyon Oranı (varsayılan 0.618) kullanılarak, algoritma en son salınım noktasından ölçülen hareketlere dayalı üç aşamalı bir gelecekteki yol hesaplar.
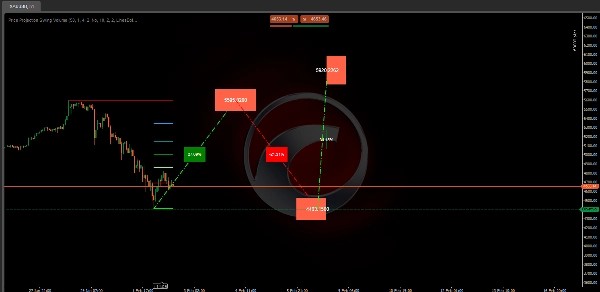
🟢 Sinyalleri ve Görselleri Yorumlama
https://chartshots.spotware.com/c/6980f126d875a
- Yatay Salınım Çizgileri: Kalın Kırmızı (Yüksek) ve Yeşil (Düşük) çizgiler piyasanın mevcut sınırlarını temsil eder. Fiyatın bunları kırması genellikle bir trend değişimini işaret eder.
- Projeksiyon Yolu (Noktalı Çizgiler): Diyagonal çizgiler "zigzag" hareketini tahmin eder. Bu, algoritmanın fiyatın nihai hedefe ulaşmak için nasıl hareket edebileceğine dair tahminidir.
- Yüzde Etiketleri: Diyagonal çizgiler üzerinde bulunan bu etiketler, hareketin o belirli segmenti için beklenen % kazanç veya kaybı gösterir.
- Hedef Fiyat Kutuları: Her segmentin sonunda bulunan renkli kutular, algoritmanın hedeflediği tam fiyat seviyesini sağlar.
⚙️ Temel Ayarlar ve Parametreler
- Geriye Dönük Dönem (50): Salınımların ölçeğini belirler. Daha yüksek bir sayı "Makro" salınımlar ararken, daha düşük bir sayı "Mikro" scalping salınımlarına odaklanır.
- Projeksiyon Oranı (0.618): Bu "Altın Oran", projekte edilen zigzagların derinliğini ve yüksekliğini belirler. Daha agresif hedefler için bunu ayarlayabilirsiniz.
- Görsel Özelleştirme: Boğa/Ayı projeksiyonları ve belirli Fibonacci seviyeleri için tamamen ayarlanabilir renkler, grafik temanızla uyumlu hale getirmek için.
🚀 Tipik Kullanım Durumları ve Senaryolar
- Hedef Belirleme: Salınım işlemleri için Kar Al seviyelerini belirlemek amacıyla projekte edilen fiyat kutularını kullanın.
- Dönüşleri Öngörme: Projeksiyon, yukarı hareket öncesinde derin bir düzeltme gösteriyorsa, traderlar giriş yapmadan önce fiyatın "vadi" noktalı çizgisine ulaşmasını bekleyebilir.
- Ölçülü Hareketler: "ABCD" desenlerini veya harmonik fiyat hareketlerini takip eden traderlar için mükemmeldir.
👤 Hedef Trader Profili
- Salınım ve Trend Traderları: Pozisyonlarını birkaç gün tutan ve potansiyel direnç için bir yol haritasına ihtiyaç duyanlar için idealdir.
- Harmonik Traderlar: Fibonacci oranlarına güvenen ancak matematiğin otomatik yapılmasını isteyen kullanıcılar için mükemmeldir.
- Deneyim Seviyesi: Orta. Traderlar bunun projeksiyonlar olduğunu anlamalı ve diğer teyitlerle birlikte kullanılmalıdır.
⚠️ Önemli Sınırlamalar ve Kullanım Notları
- Dinamik Güncelleme: Projeksiyonlar ve salınım seviyeleri, geri dönüş penceresi içinde yeni bir Yüksek veya Düşük oluşursa gerçek zamanlı olarak "kayacaktır".
- Başlatma: Gösterge, doğru çizim yapmaya başlamadan önce minimum bir geçmişe (Geriye Dönük Dönem kadar) ihtiyaç duyar.
Özet
The indicator visually displays horizontal swing boundary lines (red for highs, green for lows), dotted diagonal projection lines with percentage gain or loss labels, and target price boxes indicating exact projected price levels. These features help traders set take profit targets, anticipate retracements or reversals, and identify measured moves consistent with harmonic patterns.
Key customizable settings include the lookback period for swing scale, projection ratio for target aggressiveness, and visual color options for bullish/bearish projections and Fibonacci levels. The indicator updates dynamically as new highs or lows form within the lookback window and requires sufficient historical data to initialize.
Price Projection Swing Volume supports multiple markets including BTCUSD, EURUSD, GBPUSD, NZDUSD, XAUUSD, NAS100, and USDJPY, making it suitable for traders using Fibonacci-based harmonic strategies and swing trading approaches.


