Beschreibung
OrderFlow Struktur SMC Indikator
Vollständiges Parameterhandbuch:
Ich habe diesen Indikator entwickelt, weil jeder SMC-Indikator, den ich ausprobiert habe, die Strukturerkennung als abgeschlossenes Problem behandelte. Sie zeichnen ein BoS-Label, sobald der Preis ein Swing-Level überschreitet, und betrachten es als erledigt. Das funktionierte vielleicht sechzig Prozent der Zeit bei klaren Trendcharts und brach überall sonst zusammen. Das Problem lag nicht in der Pivot-Logik. Es war, dass ein struktureller Bruch für sich genommen nichts darüber aussagt, ob die Bewegung tatsächlich Beteiligung dahinter hat, und die meisten "Sweep"-Erkennungen in Retail-Tools feuern am Docht, bevor die Umkehr überhaupt begonnen hat.
Dieser Indikator ist mein Versuch, beide Probleme auf einem einzigen Chart zu beheben.
Was er analysiert
Der Indikator liest drei Dinge aus den Balkendaten: Pivot-Struktur, Dochtverhalten an ungebrochenen Swing-Levels und einen Flow-Score, der aus standardisierten Log-Renditen, gewichtet mit Tick-Volumen, abgeleitet wird.
Struktur läuft auf zwei unabhängigen Strömen. Der interne Stream verwendet eine kurze Pivot-Länge (Standard 5) und erfasst Mikroverschiebungen im Preis. Der Swing-Stream verwendet eine längere Länge (Standard 25) und verfolgt den Kontext des höheren Zeitrahmens. Jeder Stream behält seinen eigenen Trendzustand bei, sodass derselbe Bruch auf einem Stream ein BoS und auf dem anderen ein CHoCH sein kann, wenn Sie diese Granularität wünschen.
Liquiditäts-Sweeps erfordern zwei Stufen. Zuerst muss der Docht eines Balkens ein ungebrochenes Swing-Level um mindestens einen Bruchteil des ATR überschreiten, der Schlusskurs muss wieder innerhalb des Levels liegen, und die Docht-Abweisung muss mindestens die Hälfte der Balkenreichweite ausmachen. Das registriert einen ausstehenden Sweep. Die Bestätigung erfolgt erst, wenn der Preis tatsächlich innerhalb weniger Balken durch die Mitte des Sweep-Balkens umkehrt. Wenn die Umkehr nicht kommt, verfällt der ausstehende Sweep und kein Signal wird ausgegeben.
Die Flow-Bewertung verwendet Bulk Volume Classification, das Modell aus dem Paper von Easley, Lopez de Prado und O'Hara von 2012 zur Flow-Toxizität. Der Indikator standardisiert die Log-Rendite jedes Balkens gegen das jüngste Volatilitätsfenster, führt sie durch die normale CDF, um einen geschätzten Kaufanteil zu erhalten, gewichtet mit Tick-Volumen und akkumuliert über ein kurzes Fenster. Das Ergebnis ist ein richtungsweisender Flow-Index zwischen minus eins und plus eins, dargestellt als Kauf-Prozent / Verkaufs-Prozent-Verhältnis. Wenn ein Bruchereignis eintritt, wird der Flow-Score mit der Bruchrichtung verglichen und ein Abzeichen neben dem Label angezeigt.
Wie man die Signale liest
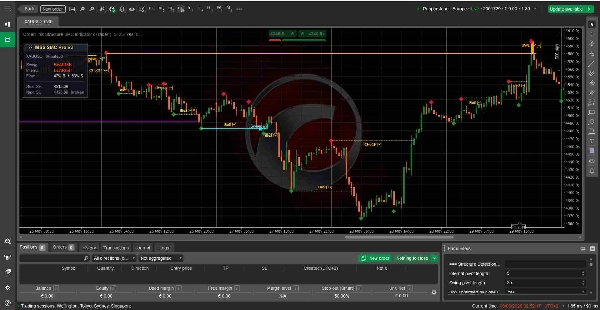
Strukturelle Ereignisse erscheinen als horizontale Linien mit Textlabels:
- BoS ist ein Strukturbruch in Richtung des bestehenden Trends. Fortsetzungssignal.
- CHoCH ist eine Charakteränderung. Der Trend hat gerade umgeschlagen. Behandeln Sie dies als Umkehrwarnung, noch keine bestätigte Umkehr.
- iBoS und iCHoCH sind dieselben Ereignisse im internen Stream, in Gold gezeichnet.
- SWEEP-Boxen markieren einen bestätigten Liquiditätszugriff und eine Umkehr. Die Box zeigt den tatsächlichen Docht, der den Sweep durchgeführt hat.
- EQH und EQL sind gleiche Hochs und Tiefs innerhalb der ATR-Toleranz, die Art von Stop-Pools, die der Preis tendenziell erneut besucht.
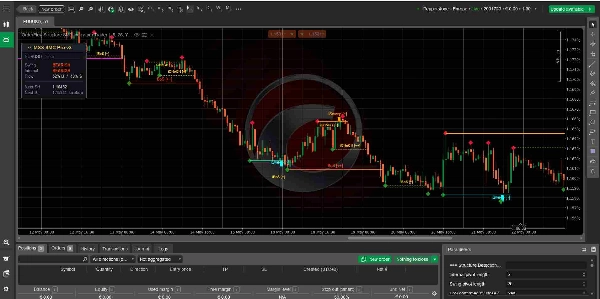
Jedes Signal trägt ein Flow-Abzeichen:
- [++] bedeutet, dass der Flow stark mit der Bruchrichtung übereinstimmt. Statistisch sind hier die saubersten Setups.
- [~] bedeutet, dass der Flow ambivalent ist. Der Bruch kann trotzdem funktionieren, aber Sie erhalten keine Bestätigung durch Beteiligung.
- [!?] bedeutet, dass der Flow dem Bruch widerspricht. Dies sind die Brüche, die oft zu Fallen werden. Keine harte Regel, aber ein nützlicher Filter.
Das Dashboard zeigt den aktuellen Zustand beider Streams (Swing-Trend, interner Trend), das Live-Flow-Verhältnis, das nächste ungebrochene Swing-Hoch und Swing-Tief, die der Indikator überwacht, sowie eine Anzahl ausstehender Sweeps, die auf Bestätigung warten. Sie können es überall im Chart verschieben, und die Position wird zwischen den Sitzungen gespeichert.
Einstellungen, die wirklich wichtig sind
Die meisten Parameter haben sinnvolle Standardwerte, die Sie beibehalten können. Die, die sich lohnen anzupassen:
Pivot-Längen. Standard intern ist 5 und Standard Swing ist 25. Niedrigere Werte machen beide Streams reaktiver, höhere Werte glatter. Auf niedrigeren Zeitrahmen würde ich intern auf 7 oder 9 erhöhen, um Rauschen zu reduzieren. Auf Tagescharts würde ich Swing auf 15 senken.
BoS bestätigt durch Schlusskurs. Standardmäßig aktiviert. Wenn Sie dies deaktivieren, feuern Brüche bei Dochtberührung statt beim Schlusskurs. Schnellere Signale, mehr Fehlalarme.
Sweep-Abweisungsprozentsatz. Standard 0,5, was bedeutet, dass der Docht mindestens die Hälfte der Balkenreichweite betragen muss. Eine Erhöhung auf 0,65 macht die Sweep-Erkennung strenger und erzeugt weniger, aber sauberere Signale.
Flow-Schwellenwerte. Stark ist 0,60, Schwach ist 0,40 standardmäßig. Eine Verschärfung von Stark auf 0,65 führt zu weniger [++]-Abzeichen, aber jedes einzelne bedeutet mehr.
Sweeps erkennen. Wenn Sie keine Sweep-Umkehrungen handeln, schalten Sie dies aus und das Chart wird weniger überladen.
Für wen das gedacht ist
Diskretionäre SMC-Trader, die Orderflow-Kontext wollen, der keine Tick-Volumen-Divergenz-Ratespiele sind. Jeder, der genug von Indikatoren hat, die bei jedem Docht einen Sweep zeichnen und es als Signal bezeichnen. Quant-orientierte Retail-Trader, die BVC als echte Mikrostrukturtechnik und nicht als Schlagwort erkennen.
Wenn Sie rein auf Preisaktion ohne Interesse an volumenbasierten Signalen handeln, sind die Flow-Abzeichen für Sie Rauschen. Die Struktur- und Sweep-Logik funktioniert auch ohne sie gut. Schalten Sie die Flow-Bestätigung in den Einstellungen aus.
Was das nicht ist
Es ist kein Level-2-Orderbuch-Leser. Retail-Plattformen haben diese Daten nicht und kein Indikator im cTrader Store tut das tatsächlich. Der Flow-Score ist eine Schätzung aus Balkendaten, kalibriert gegen die jüngste Volatilität. Er ist richtungsweisend nützlich, aber nicht auf Börsen-Niveau.
Es ist kein Autotrading-Roboter. Es zeichnet im Chart und sendet Alarme. Handelsentscheidungen liegen bei Ihnen.
Es wird nicht jede Bewegung erfassen. Pivot-Bestätigung erfordert Balken auf beiden Seiten des Pivots, daher hinkt der Struktur-Stream bei schnellen vertikalen Bewegungen definitionsgemäß hinterher. Das ist ein Merkmal der Funktionsweise der Strukturerkennung, kein Fehler.
Zusammenfassung
Liquidity sweeps are detected through a two-stage process requiring wick extension beyond swing levels and subsequent price reversal confirmation, marking confirmed liquidity grabs. The flow score estimates directional participation by standardizing log-returns weighted by tick volume, producing a buy/sell ratio that accompanies break signals with badges indicating agreement, ambivalence, or opposition to the break direction.
A dashboard displays current trend states for both streams, live flow ratio, monitored swing levels, and pending sweeps. Key adjustable parameters include pivot lengths, BoS confirmation by close, sweep rejection thresholds, and flow score sensitivity. The indicator is designed for discretionary Smart Money Concept (SMC) traders seeking volume-informed structure signals beyond simple price action, without automated trading functionality or Level 2 order book data.