


Beschreibung
SMC Smart Money Suite Pro — Komplettes institutionelles Price Action Toolkit für cTrader
Wenn Sie mit Smart Money Konzepten oder einer Price Action Methodik handeln, die auf institutionellem Orderflow basiert, kennen Sie das Problem: ein Dutzend Indikatoren, die über Ihr Chart verstreut sind, jeder erledigt teilweise seine Aufgabe, aber keiner kommuniziert miteinander. Smart Money Suite Pro wurde entwickelt, um genau dieses Problem vollständig zu lösen.
Dies ist ein einzelner, eigenständiger Indikator, der jedes wichtige Konzept innerhalb der institutionellen Price Action und Smart Money Methodik abdeckt — von Grund auf für cTrader entwickelt, optimiert für eine saubere Darstellung in Live-Charts ohne Flackern und ausgestattet mit praktischen Funktionen, die ihn in echten Handelssitzungen wirklich nutzbar machen.
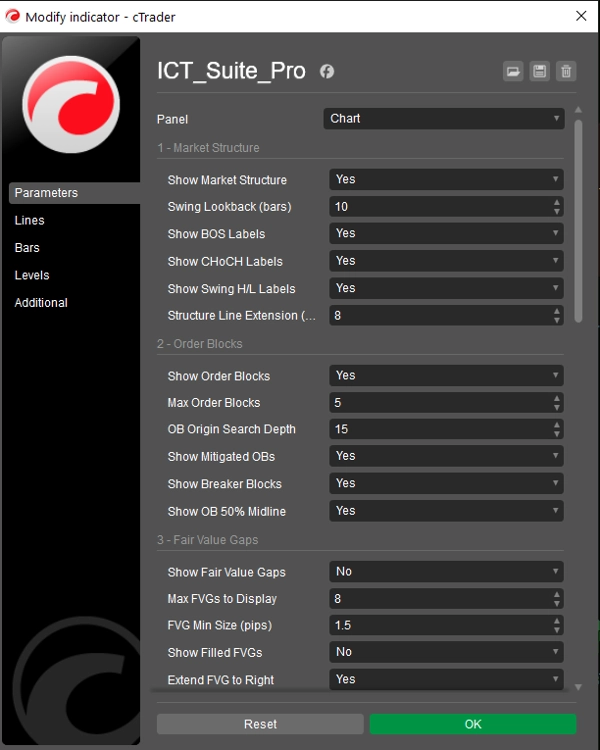
Marktstruktur — Automatisch und Präzise
Der Indikator scannt kontinuierlich Ihr Chart nach bestätigten Swing-Hochs und -Tiefs und klassifiziert jedes als Higher High, Lower High, Higher Low oder Lower Low. Jeder Break of Structure (BOS) und Change of Character (CHoCH) wird erkannt und mit einer gepunkteten Linienmarkierung versehen, sodass Sie genau sehen können, wo der Preis die vorherige Struktur durchbrochen hat. Die Unterscheidung zwischen BOS (Trendfortsetzung) und CHoCH (Trendumkehr) ist farblich codiert, sodass sie auf einen Blick erkennbar ist. Die Tiefe des Swing-Lookbacks ist vollständig anpassbar.
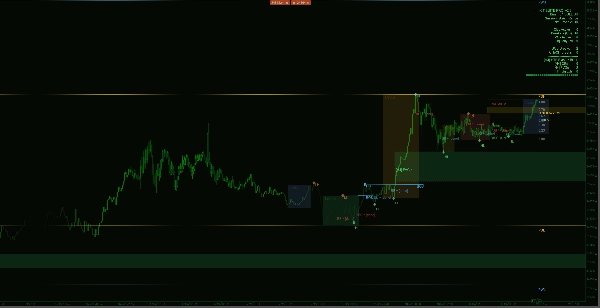
Orderblöcke — Mit vollständiger Lebenszyklusverfolgung
Orderblöcke werden identifiziert, indem die letzte entgegengesetzte Kerze vor jeder Impulsbewegung gefunden wird, die zu einem bestätigten Swing führte. Jeder Block wird als farbige Box gezeichnet, die sich nach rechts im Chart erstreckt, sodass Sie auf einen Blick sehen können, ob der Preis in die Zone zurückgekehrt ist. Wenn ein Orderblock mitigiert wird, wird das Rechteck entfernt und durch eine schwache Textmarkierung ersetzt — so bleibt Ihr Chart sauber, während das Level dokumentiert wird. Wenn der Preis anschließend die andere Seite eines mitigierten Orderblocks durchbricht, wird dieser als Breaker Block neu klassifiziert und umgefärbt, was eine potenzielle Umkehrzone signalisiert. Eine 50% Mittellinie wird innerhalb jedes aktiven Blocks gezeichnet, um die Premium-/Discount-Grenze innerhalb der Zone hervorzuheben.
Fair Value Gaps — Verfolgt bis zur Schließung
Drei-Kerzen-Preisungleichgewichte werden in beide Richtungen über Ihr gesamtes Lookback-Fenster erkannt. Jede Lücke wird durch eine konfigurierbare Mindest-Pip-Größe gefiltert, um Rauschen zu eliminieren. Ungefüllte Lücken erstrecken sich nach rechts im Chart, bis der Preis zurückkehrt, um sie zu schließen, woraufhin sie je nach Einstellung entweder entfernt oder als gefüllt markiert werden. Sowohl bullische als auch bärische Ungleichgewichte werden gleichzeitig behandelt.
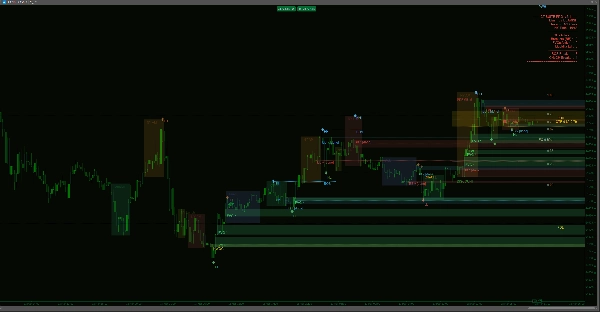
Liquiditätsniveaus — Gleichhochs und Gleichtiefs
Der Indikator sucht nach Clustern von Swing-Hochs oder Swing-Tiefs, die innerhalb einer konfigurierbaren Pip-Toleranz zueinander liegen — und identifiziert so die Kauf- und Verkaufsliquiditätspools, die institutioneller Orderflow typischerweise anvisiert. Jedes Level wird mit Markierungen an beiden Swing-Punkten und einer gepunkteten Linie nach rechts gezeichnet. Sobald der Preis ein Liquiditätsniveau durchläuft, wird es je nach Präferenz entweder ausgeblendet oder als durchlaufen markiert.
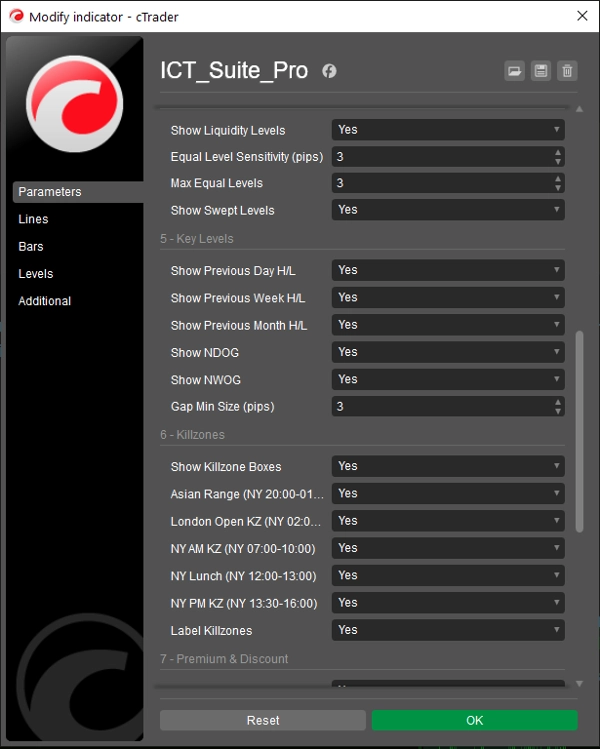
Schlüsselebenen — Vorheriger Tag, Woche und Monat
Vorheriges Tageshoch/-tief, vorheriges Wochenhoch/-tief und vorheriges Monathoch/-tief werden automatisch aus den Preisdaten Ihres Charts berechnet. Alle Datumsgrenzen basieren auf den Bar-Zeitstempeln des Brokers — nicht auf Ihrer lokalen Systemuhr — und bleiben somit unabhängig von Ihrer Zeitzone oder Instrumenten-Rollover genau. Jedes Level-Paar verwendet eine eigene Farbe und Linienart, sodass sie sauber im Chart übereinander liegen.
Eröffnungslücken — Täglich und Wöchentlich
Der Indikator scannt jede tägliche und wöchentliche Eröffnung nach einer Preislücke zwischen dem Schlusskurs der vorherigen Sitzung und der Eröffnung der aktuellen Sitzung. Jede Lücke, die Ihre definierte Mindest-Pip-Größe überschreitet, wird als farbige Rechteck gezeichnet. Neue Tages-Eröffnungslücken und neue Wochen-Eröffnungslücken werden durch unterschiedliche Farben unterschieden, sodass Sie sofort erkennen, welche Lücken noch offen sind.
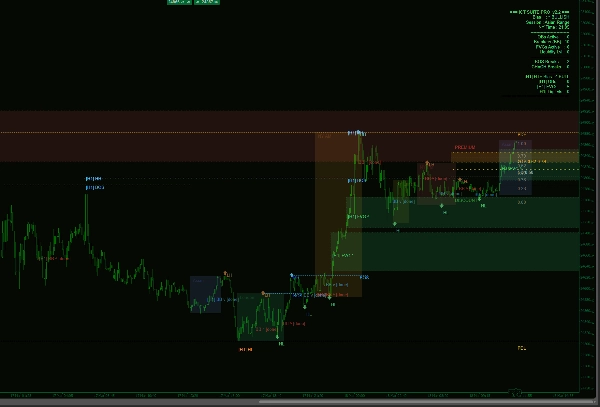
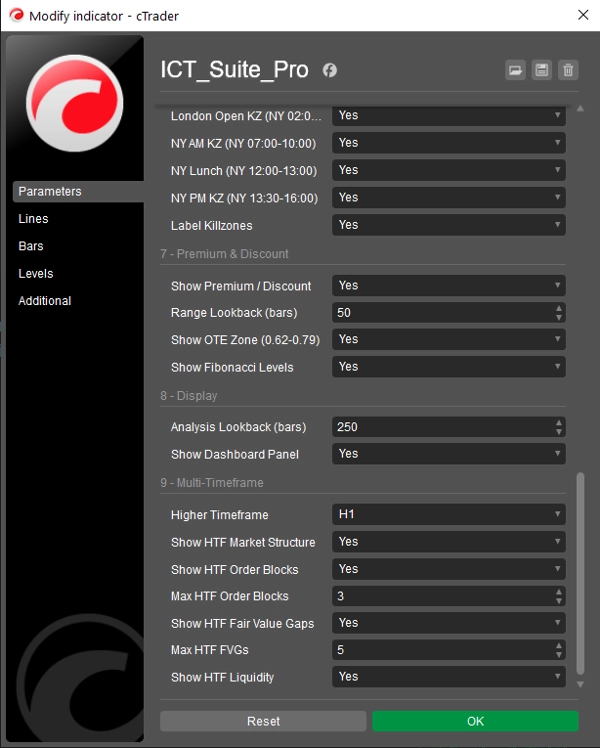
Session Killzones — Mit realen Range-Boxen
Asiatische, London Open, New York AM, New York Lunch und New York PM Sessions werden als gefüllte Boxen gezeichnet, die die tatsächliche Hoch-Tief-Spanne während jeder Periode abdecken. Die Zeiten basieren auf New Yorker Zeit und passen sich automatisch an EDT/EST Sommerzeit an. Jede Box kann einzeln ein- und ausgeschaltet sowie beschriftet werden. Da die Boxen die tatsächliche Preisspanne und nicht feste vertikale Linien widerspiegeln, sehen Sie sofort, wie aktiv jede Session war und wo der Preis seine Extremwerte fand.
Premium- & Discount-Zonen — Mit optimaler Einstiegsrange
Eine rollierende Range-Analyse berechnet das höchste Hoch und das niedrigste Tief über einen konfigurierbaren Lookback. Aus dieser Range zeichnet der Indikator das Gleichgewicht (0,50), eine optimale Einstiegszone (0,62–0,79 Fibonacci) und die vollständige Reihe der wichtigen Fibonacci-Retracement-Level. Premium- und Discount-Labels werden innerhalb der Range platziert, sodass Sie immer wissen, in welcher Hälfte der aktuellen Handelsrange sich der Preis bewegt. Der Lookback wird automatisch an Ihr sichtbares Balkenfenster angepasst, sodass keine Level auf nicht sichtbare Balken referenzieren.
Multi-Timeframe-Overlay — Das herausragende Feature
Das MTF-System rekonstruiert höherzeitige Kerzen, indem es die Balken des aktuellen Charts in zeitlich ausgerichtete Slots aggregiert — kein separater Datenabonnement erforderlich. Wählen Sie Ihren höheren Zeitrahmen aus dem Dropdown (M5, M15, M30, H1, H4, D1) und Smart Money Suite Pro berechnet und zeichnet höherzeitige Orderblöcke, Fair Value Gaps, Marktstruktur und Liquiditätsniveaus direkt über Ihrem aktuellen Chart. Höherzeitige Elemente sind visuell unterscheidbar: dickere Rahmen, gestrichelte Umrisse und Labels mit dem Zeitrahmen-Präfix (z.B. [H4] OB ^), sodass Sie immer wissen, zu welchem Zeitrahmen ein Level gehört.
Wenn Sie einen höheren Zeitrahmen wählen, der gleich oder niedriger als Ihr aktueller Chart-Zeitrahmen ist — eine unmögliche Konfiguration — zeigt der Indikator eine klare Warnung auf dem Bildschirm an und zeichnet nichts, um irreführende Daten zu vermeiden.
Das Dashboard-Panel aktualisiert sich mit einem eigenen höherzeitigen Abschnitt, wenn das Overlay aktiv ist, und zeigt HTF-Bias, Anzahl aktiver Orderblöcke, Fair Value Gaps und Liquiditätsniveaus neben der Zusammenfassung des aktuellen Zeitrahmens an.
Live-Dashboard
Ein sauberes, rechts verankertes Panel zeigt: aktuellen Marktbias, aktive Handelssession, New Yorker Zeit, Anzahl aller aktiven Orderblöcke, Breaker Blocks, Fair Value Gaps und Liquiditätsniveaus sowie die Gesamtzahl der im Lookback-Fenster erkannten BOS- und CHoCH-Brüche. Wenn das Multi-Timeframe-Overlay aktiviert ist, wird die höherzeitige Zusammenfassung automatisch darunter angehängt.
Für den Live-Handel entwickelt
Der Indikator zeichnet nur neu, wenn ein neuer Balken entsteht — nicht bei jedem eingehenden Tick — und eliminiert so das Flackern im Chart, das viele All-in-One-Indikatoren beeinträchtigt. Alle Analysen laufen innerhalb eines konfigurierbaren Lookback-Fensters, sodass die Leistung auch bei niedrigeren Zeitrahmen mit vielen Balken konstant bleibt.
Zusammenfassung
SMC-Pro features premium and discount zones derived from Fibonacci retracement levels within a rolling price range, aiding optimal entry identification. A standout multi-timeframe overlay reconstructs higher timeframe candles and displays their corresponding order blocks, fair value gaps, market structure, and liquidity levels directly on the current chart, with clear visual distinctions and a dashboard summary of both current and higher timeframe data.
The indicator is optimized for live trading with efficient redraws only on new bars to prevent flicker and maintains performance via a configurable lookback window. It supports various markets including Forex, indices, and cryptocurrencies such as BTCUSD and XAUUSD.
Kundenbewertungen
5 | 50 % | |
4 | 50 % | |
3 | 0 % | |
2 | 0 % | |
1 | 0 % |


![„[Stellar Strategies] MARSI Signal Plotter“-Logo](https://cdn.ctrader.com/image/webp/7b2b8da6-8f8e-4646-8d4a-4710c516c01e_25567)

