
Beschreibung
Korrelationskarte – Ihr unverzichtbares Werkzeug für Marktanalysen
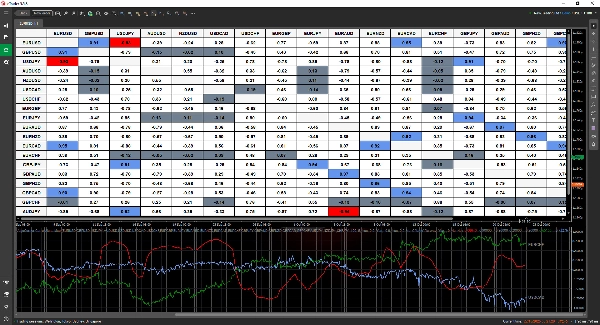
Die Korrelationskarte ist ein leistungsstarker und dennoch intuitiver Indikator, der Ihnen hilft, Zusammenhänge zwischen Vermögenswerten auf einen Blick zu erkennen. Mit ihrem leicht lesbaren Tabellenformat können Sie schnell Korrelationen erkennen und fundiertere Handelsentscheidungen treffen.
✅ Passen Sie Ihre Analyse an – Wählen und vergleichen Sie so viele Handelspaare, wie Ihre Plattform zulässt.
✅ Flexible Zeitrahmen – Analysieren Sie Korrelationen über jeden beliebigen Zeitraum, der zu Ihrer Strategie passt.
✅ Klare & anpassbare Anzeige – Wählen Sie zwischen Dezimal- (-1 bis 1) oder Prozentangaben (-100 % bis 100 %).
✅ Intelligente Hervorhebung – Erkennen Sie starke und schwache Korrelationen leicht durch anpassbare Farbkennzeichnung.
✅ Echtzeit-Benachrichtigungen – Bleiben Sie informiert, wenn sich Korrelationswerte signifikant ändern.
✅ Interaktive Daten – Klicken Sie auf eine beliebige Zelle, um zu verfolgen, wie sich Korrelationen im Laufe der Zeit entwickeln.
✅ Fortlaufende Verbesserungen – Profitieren Sie von zukünftigen Updates ohne zusätzliche Kosten.
Entdecken Sie wichtige Marktbeziehungen und verfeinern Sie Ihre Handelsstrategie mit der Korrelationskarte! 🚀
Zusammenfassung
Key features include customizable display options with correlation values shown in decimal (-1 to 1) or percentage (-100% to 100%) formats, and smart color-coded highlighting to quickly identify strong or weak correlations. Users can interact with the data by clicking on any cell to track how correlations evolve over time. Real-time alerts notify users of significant changes in correlation values, aiding timely decision-making.
This tool is intended to help traders uncover relationships between assets efficiently, supporting more informed market analysis and strategy refinement.
Kundenbewertungen
5 | 67 % | |
4 | 33 % | |
3 | 0 % | |
2 | 0 % | |
1 | 0 % |


