
VegaXLR - Fibonacci Bands
อินดิเคเตอร์
2 การซื้อ
เวอร์ชัน 1.0, Feb 2025
Windows, Mac
5.0
รีวิว: 2
คำอธิบาย
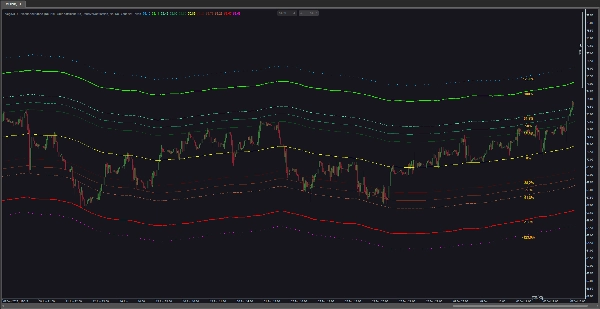
หากคุณกำลังมองหาตัวบ่งชี้ช่อง Fibonacci แบบไดนามิกสำหรับ cTrader ไม่ต้องมองหาที่อื่น ตัวบ่งชี้นี้จะวาดแถบ Fibonacci อัตโนมัติขนานกับค่าเฉลี่ยเคลื่อนที่ที่คุณเลือก ใช้งานง่ายและเหมือนกับตัวบ่งชี้อื่น ๆ ของฉัน มีการแจ้งเตือนผ่านป๊อปอัพ เสียง อีเมล และข้อความ Telegram นอกจากนี้ คุณยังสามารถปรับแต่งแถบ ระดับ Fibonacci และการแจ้งเตือนได้ตามต้องการ
นี่คือรายการคุณสมบัติของมัน:
- การคำนวณแถบ Fibonacci: ตัวบ่งชี้จะคำนวณและวาดแถบ Fibonacci ตามค่าเฉลี่ยเคลื่อนที่ที่คุณเลือก แถบเหล่านี้มาจากระดับ Fibonacci (เช่น 0.0%, 38.2%, 61.8% หรืออื่น ๆ) และขยายขึ้นและลงจากค่าเฉลี่ยเคลื่อนที่ด้วยปัจจัยที่กำหนด
- การตั้งค่าค่าเฉลี่ยเคลื่อนที่: ปรับแต่งประเภทค่าเฉลี่ยเคลื่อนที่ (เช่น แบบง่าย, แบบเลขชี้กำลัง ฯลฯ) และจำนวนช่วงเวลาที่ใช้ในการคำนวณ ค่าเฉลี่ยเคลื่อนที่นี้เป็นพื้นฐานสำหรับแถบ Fibonacci
- ฟังก์ชันการแจ้งเตือน: ตัวบ่งชี้มีตัวเลือกการแจ้งเตือนหลากหลายเพื่อแจ้งเตือนผู้เทรดเกี่ยวกับเหตุการณ์เฉพาะ รวมถึงการแจ้งเตือนเมื่อราคาสัมผัสระดับและการแจ้งเตือนความใกล้เคียง
- การแจ้งเตือนเมื่อราคาสัมผัสระดับ: ตั้งค่าตัวบ่งชี้ให้ส่งการแจ้งเตือนเมื่อราคาสัมผัสระดับ Fibonacci ที่กำหนด การแจ้งเตือนสามารถตั้งให้เกิดขึ้นตามราคาปิดหรือทันทีที่ราคาสัมผัสระดับนั้น
- การแจ้งเตือนความใกล้เคียง: ตั้งค่าการแจ้งเตือนความใกล้เคียงเพื่อรับการแจ้งเตือนเมื่อราคามาใกล้หรือเคลื่อนห่างจากระดับ Fibonacci ที่กำหนดภายในระยะที่กำหนด การแจ้งเตือนสามารถเกิดขึ้นเมื่อราคากำลังเข้าใกล้หรือเคลื่อนห่างจากระดับนั้น
- ตัวเลือกการแสดงผลการแจ้งเตือน: เลือกจากการแจ้งเตือนด้วยเสียง ป๊อปอัพ ข้อความ Telegram และอีเมลสำหรับการแจ้งเตือน เสียงแจ้งเตือนสามารถปรับแต่งได้โดยเลือกไฟล์เสียงต่าง ๆ
- ตัวเลือกการแสดงผล: ปรับแต่งการแสดงผลของระดับ Fibonacci ด้วยตัวเลือกต่าง ๆ เช่น การแสดงค่าร้อยละ การตั้งค่าสีสำหรับป้ายร้อยละ การควบคุมตำแหน่งป้ายบนแผนภูมิ การเปิด/ปิดแถบเฉพาะ และการเลือกสี ความหนา และลักษณะของแถบ
- ระดับ Fibonacci ที่ปรับแต่งได้: ปรับตัวบ่งชี้ให้เหมาะกับกลยุทธ์การเทรดของคุณโดยการปรับระดับ Fibonacci เฉพาะที่ใช้ในการคำนวณ ระดับ Fibonacci บวกและลบสามารถปรับแต่งแยกกันได้
- คู่มือผู้ใช้ในตัว: คุณสามารถเข้าถึงคู่มือผู้ใช้สำหรับตัวบ่งชี้นี้ได้โดยตรงจากแผนภูมิ
โดยสรุป ตัวบ่งชี้ VegaXLR - Fibonacci Bands รวมการวิเคราะห์ Fibonacci และค่าเฉลี่ยเคลื่อนที่เพื่อช่วยระบุระดับแนวรับและแนวต้านที่เป็นไปได้ ด้วยฟังก์ชันการแจ้งเตือนที่ปรับแต่งได้และตัวเลือกการแสดงผล มันเป็นเครื่องมือที่มีค่าสำหรับผู้เทรดที่พึ่งพาการถอยกลับหรือการขยายตัวของ Fibonacci
สรุป
สรุปโดย AI
VegaXLR - Fibonacci Bands is a dynamic indicator for cTrader that automatically plots customizable Fibonacci bands parallel to a user-selected moving average. Traders can configure the moving average type (e.g., Simple, Exponential) and periods, which serve as the basis for the Fibonacci bands derived from adjustable Fibonacci levels (such as 0.0%, 38.2%, 61.8%, and others). The indicator supports both positive and negative Fibonacci levels, allowing tailored analysis.
It features multiple alert options including price level touch alerts—triggered on price contact or close at specified Fibonacci levels—and proximity alerts that notify when price approaches or moves away from these levels within a defined range. Alerts can be delivered via pop-up, sound (with customizable sounds), email, and Telegram messages.
Visualization settings enable customization of band colors, thickness, label display and position, and selective enabling or disabling of bands. A built-in user guide is accessible directly from the chart for ease of use.
Overall, VegaXLR - Fibonacci Bands combines Fibonacci retracement and expansion analysis with moving averages to assist traders in identifying potential support and resistance zones, enhanced by configurable alerts and visualization options.
โปรไฟล์อินดิเคเตอร์
รีวิวจากลูกค้า
5.0
รีวิว: 2
5 | 100 % | |
4 | 0 % | |
3 | 0 % | |
2 | 0 % | |
1 | 0 % |
รีวิวจากลูกค้า
February 23, 2025
the setup gets a moment before execution, but a real person still needs review the setup.
February 19, 2025
การสนทนา
คำถามที่พบบ่อย
Forex
ผลิตภัณฑ์ที่มีให้บริการผ่าน cTrader Store รวมถึงบอทการเทรด อินดิเคเตอร์ และปลั๊กอิน มีให้บริการโดยนักพัฒนาบุคคลที่สามและมีไว้เพื่อวัตถุประสงค์ในการเข้าถึงข้อมูลและทางเทคนิคเท่านั้น cTrader Store ไม่ใช่โบรกเกอร์และไม่ได้ให้คำแนะนำการลงทุน คำแนะนำส่วนบุคคล หรือการรับประกันผลการดำเนินงานในอนาคต


ราคา
232
การขาย
695
ติดตั้งฟรี