
คำอธิบาย
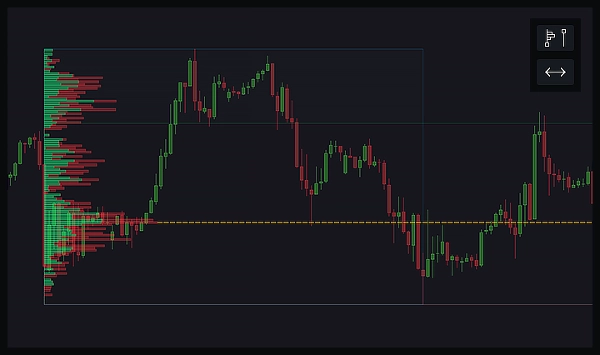
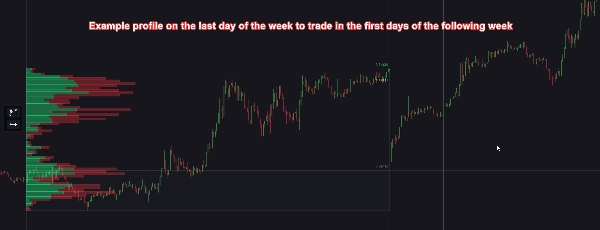
Fixed Range Volume Profile คือเครื่องมือที่แสดงกิจกรรมการซื้อขายที่เกิดขึ้นในระดับราคาต่างๆ ภายในช่วงเวลาที่กำหนดบนกราฟ คุณสามารถวาดสี่เหลี่ยมบนพื้นที่ที่สนใจ และโปรไฟล์จะแสดงแถบแนวนอนที่บ่งบอกปริมาณการซื้อขายในแต่ละระดับราคาภายในช่วงนั้น ซึ่งช่วยให้คุณเห็นว่ามีการซื้อขายมากที่สุดที่จุดใด โดยเน้นระดับราคาสำคัญที่อาจมีความสำคัญสำหรับการตัดสินใจซื้อขาย
ส่วนประกอบหลักของ Fixed Range Volume Profile ได้แก่:
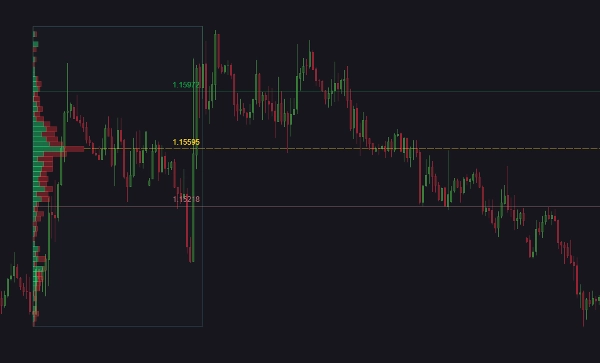
- Point of Control (POC): ระดับราคาที่มีปริมาณการซื้อขายสูงสุดภายในช่วงที่เลือก ซึ่งมักถูกมองว่าเป็นระดับแนวรับหรือแนวต้านที่สำคัญเนื่องจากสะท้อนถึงราคาที่มีกิจกรรมการซื้อขายมาก
- Value Area High (VAH): ขอบเขตบนของช่วงราคาที่มีปริมาณการซื้อขายรวม 70% ราคาที่สูงกว่าระดับนี้ถือว่ามีการซื้อขายน้อยและอาจมีราคาสูงเกินไป
- Value Area Low (VAL): ขอบเขตล่างของช่วงราคาที่มีปริมาณการซื้อขายรวม 70% ราคาที่ต่ำกว่าระดับนี้ถือว่ามีการซื้อขายน้อยและอาจมีราคาต่ำเกินไป
เส้นเหล่านี้ช่วยให้ผู้ซื้อขายระบุระดับราคาสำคัญที่สามารถทำหน้าที่เป็นแนวรับหรือแนวต้านได้ โดยการเข้าใจว่าปริมาณการซื้อขายส่วนใหญ่กระจุกตัวอยู่ที่ใด ผู้ซื้อขายสามารถตัดสินใจได้อย่างมีข้อมูลมากขึ้นเกี่ยวกับการเคลื่อนไหวของราคา จุดเข้า และจุดออก
ตัวอย่างเช่น หากราคาปัจจุบันอยู่ใกล้กับ POC อาจบ่งชี้ถึงระดับแนวรับหรือแนวต้านที่แข็งแกร่ง หากราคาอยู่ภายในพื้นที่มูลค่า จะบ่งชี้ว่าอยู่ในช่วงราคาที่เหมาะสม ขณะที่ราคานอกพื้นที่มูลค่าอาจถูกมองว่าเป็นจุดที่อาจเกิดการเบรกเอาท์หรือเบรกดาวน์
สิ่งที่ตัวบ่งชี้นี้ทำ:
ตัวบ่งชี้นี้ช่วยเพิ่มประสิทธิภาพกราฟการซื้อขายของคุณด้วยการวิเคราะห์โปรไฟล์ปริมาณที่ทรงพลังและการแจ้งเตือนที่ปรับแต่งได้ ด้วยปุ่มสองปุ่มที่ใช้งานง่าย คุณสามารถวาดโปรไฟล์ปริมาณช่วงคงที่และขยายหรือย่อระดับสำคัญไปจนถึงอนันต์ได้ โปรไฟล์ปริมาณสามารถแสดงผลในสองโหมด คือ ปริมาณรวม หรือแถบขึ้นและลง ปรับจำนวนระดับ ความละเอียดของข้อมูล (แม่นยำหรือเร็ว) และขนาดของพื้นที่มูลค่าให้เหมาะสมกับความต้องการของคุณ
ช่วงแม่เหล็กจะอัปเดตโดยอัตโนมัติตามแท่งเทียนล่าสุด เพื่อให้การวิเคราะห์ของคุณทันสมัย คุณยังสามารถปรับแต่งลักษณะและพฤติกรรมของโปรไฟล์และส่วนประกอบต่างๆ รวมถึงเส้น POC, VAH และ VAL ได้ การแจ้งเตือนสามารถตั้งค่าเมื่อราคาสัมผัสเส้นเหล่านี้ โดยมีตัวเลือกให้เริ่มหรือหยุด cBots และปิดตำแหน่ง การแจ้งเตือนสามารถส่งผ่านเสียง ป๊อปอัป cTrader ข้อความ Telegram (พร้อมภาพหน้าจอถ้าต้องการ) และอีเมล
คุณสมบัติ:
- Fixed Range Volume Profile: วาดสี่เหลี่ยมเพื่อแสดงโปรไฟล์ปริมาณของช่วงที่เลือก
- Expand/Contract Lines: ขยายหรือย่อเส้น POC, VAH และ VAL ไปจนถึงอนันต์
- Volume Profile Modes: เลือกระหว่างปริมาณรวม หรือแถบขึ้นและลง
- Customizable Levels and Resolution: เลือกจำนวนระดับและความละเอียด (แม่นยำหรือเร็ว)
- Adjustable Value Area: กำหนดขนาดของพื้นที่มูลค่า
- Magnetic Ranges: ปรับขนาดช่วงโดยอัตโนมัติเพื่อให้ตรงกับแท่งเทียนล่าสุด อัปเดตทุก 1–10 นาที หรือเมื่อแท่งเทียนปิด
- Customizable Appearance: เปลี่ยนตำแหน่ง ขนาด และสไตล์ของปุ่ม เส้น และแถบปริมาณ
- Alerts for Price Touches: รับการแจ้งเตือนเมื่อราคาสัมผัสเส้น POC, VAH หรือ VAL
- cBot Integration: เริ่มหรือหยุด cBots ตามการแจ้งเตือน
- Position Management: ปิดตำแหน่งเมื่อเกิดการแจ้งเตือน พร้อมตัวเลือกปรับแต่งสำหรับแต่ละเส้น (POC, VAH และ VAL)
- Alert Methods: รับการแจ้งเตือนผ่านเสียง ป๊อปอัป cTrader ข้อความ Telegram (พร้อมภาพหน้าจอถ้าต้องการ) และอีเมล
- Performance Optimization: ตัวเลือกลบช่วงเวลาที่ไม่แสดงบนกราฟโดยอัตโนมัติเพื่อเพิ่มประสิทธิภาพ
- Global Alert Control: เปิดหรือปิดการแจ้งเตือนทั้งหมดจากตัวบ่งชี้นี้ได้อย่างง่ายดาย
- User Guide: คุณสามารถเปิดคู่มือผู้ใช้ของตัวบ่งชี้นี้ได้อย่างง่ายดายผ่านปุ่มเล็กๆ บนกราฟ
สรุป
The indicator offers two visualization modes: total volume or separate up and down volume bars. It features customizable settings for the number of volume levels, data resolution (Precise or Fast), and value area size. Magnetic ranges automatically update based on the latest candle to keep analysis current. Users can expand or contract POC, VAH, and VAL lines infinitely.
Alerts can be configured for price touches on these key levels, with notifications via sound, platform pop-ups, Telegram (including optional screenshots), and email. Alerts can trigger actions such as starting/stopping cBots or closing positions. The indicator also supports customizable appearance, performance optimization by auto-deleting out-of-view ranges, and global alert control. A user guide is accessible directly from the chart interface.
รีวิวจากลูกค้า
5 | 67 % | |
4 | 0 % | |
3 | 33 % | |
2 | 0 % | |
1 | 0 % |


!["[Stellar Strategies] MARSI Signal Plotter" โลโก้](https://cdn.ctrader.com/image/webp/7b2b8da6-8f8e-4646-8d4a-4710c516c01e_25567)
!["[Hamster-Coder] Bollinger Bands" โลโก้](https://cdn.ctrader.com/image/webp/21d8e5d6-fb11-4bac-b9ee-cd05c2b76804_30327)


!["[Hamster-Coder] Pivot Points MTF" โลโก้](https://cdn.ctrader.com/image/webp/4c143e5a-309c-40e3-a578-f04d1e133ffa_31159)


