
Açıklama
MACD Custom MTF (Çoklu Zaman Dilimi) v1.1 klasik MACD'nin kanıtlanmış gücünü çoklu zaman dilimi analizinin kritik avantajı ve modern, sezgisel görselleştirme ile birleştiren gelişmiş bir araçtır. Kesinlik, hızlı yorumlama ve araçları benzersiz stratejinize göre uyarlama yeteneği talep eden seçkin tüccarlar için tasarlanmıştır.
Sürüm 1.1'de Yenilikler:
- %100 Pürüzsüz Görseller: Kırık/kesintili MACD çizgileri düzeltildi – çizgiler artık trend değişiklikleri sırasında tamamen kesintisiz.
- Daha İyi Görünürlük: Al/Sat sinyal noktalarının boyutu artırıldı, Sinyal Çizgisi ve Histogram kalınlaştırıldı, net bir görünüm için. Göz yorgunluğunu azaltmak için Sıfır Çizgisi karartıldı.
- Akıllı ve Basitleştirilmiş Uyarılar: Ayarlar penceresi temizlendi. Sadece "Al Uyarısı" veya "Sat Uyarısı"nı açın ve gösterge ekran üzerindeki Popupları ve doğru ses bildirimlerini otomatik olarak yönetir.
- Düzenli Ayarlar: Tüm parametreler artık çok daha iyi bir kullanıcı deneyimi için sezgisel kategorilere güzelce gruplanmıştır.
- Tam İngilizce Yerelleştirme: Tüm günlük mesajları, popuplar ve hatalar tamamen İngilizceye yerelleştirildi.
Tek Bir Grafikte Çoklu Zaman Dilimi (MTF) Analizi:
Grafik değiştirmeyi bırakın! Daha yüksek bir zaman diliminden (örneğin, H1, H4, D1) MACD verilerini doğrudan mevcut çalışma grafiğinize (örneğin, M5, M15) gösterin. Değerli daha geniş piyasa bağlamı kazanın, baskın temel trendleri belirleyin ve daha düşük zaman dilimlerinden gelen yanıltıcı gürültüyü etkili şekilde filtreleyin. Tam yapılandırılabilir – dakikalardan aylığa kadar kapsamlı bir zaman dilimi listesinden seçim yapabilirsiniz.
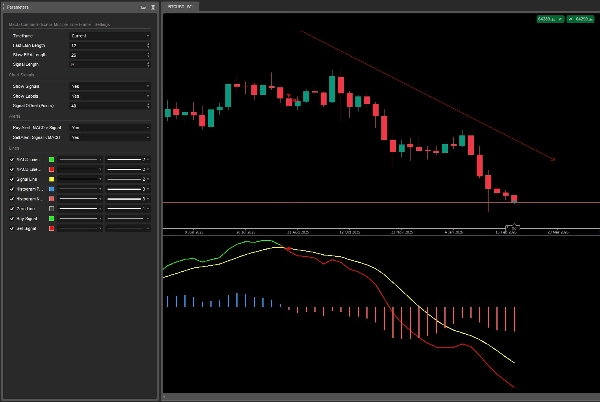
Dinamik MACD ve Sinyal Çizgisi Renklendirmesi:
Anında trend onayı: MACD çizgisi, sinyal çizgisini geçtiğinde dinamik olarak renk değiştirir, yükseliş veya düşüş momentumunu canlı şekilde gösterir. Artık tahmin yok – çizgi rengi MACD'nin sinyalinin üzerinde (yükseliş) veya altında (düşüş) olduğunu hemen bildirir.
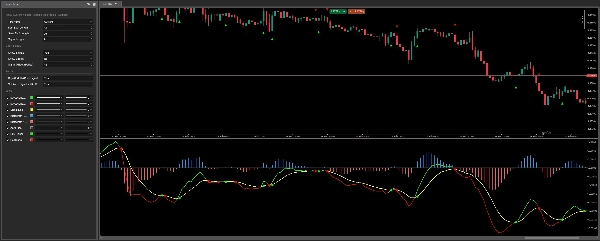
Kristal Netliğinde Histogram:
MACD ile sinyal çizgisi arasındaki uyumsuzluğu (gücü) kolayca görselleştirin. Gösterge, kalınlaştırılmış çubukları pozitif (mavi) veya negatif (kırmızı) olmalarına göre sezgisel olarak renklendirir ve momentum değişimlerine tek bakışta derin bir içgörü sağlar.
Yanıltmaz Görsel Kesişim Sinyalleri:
Kritik bir kesişimi asla kaçırmayın! Gösterge MACD/Sinyal çizgisi kesişimlerini otomatik olarak vurgular. Fiyat grafiğinizde (ayarlanabilir ofset ile) belirgin, yüksek görünürlükte noktalar çizer ve nihai netlik için isteğe bağlı "Al"/"Sat" metin etiketleri sunar.
Entegre Akıllı Uyarılar:
Al ve Sat sinyalleri için yerleşik, sorunsuz Popup ve Ses bildirimleri içerir. Ekranınıza yapışmadan her fırsattan haberdar olun! Sadece ayarlarda uyarıları açın ve göstergenin sizin için izlemesine izin verin.
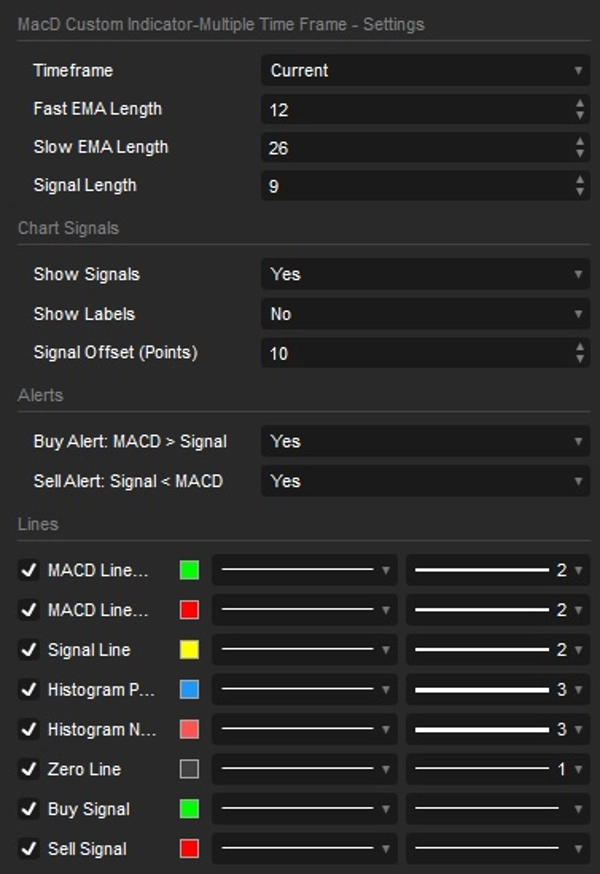
Parmaklarınızın Ucunda Tam Özelleştirme:
- Hızlı EMA, Yavaş EMA ve Sinyal Çizgisi uzunluklarını tam olarak istediğiniz gibi ayarlayın.
- Tüm ayarlar mantıklı gruplar halinde (MACD Ayarları, Grafik Sinyalleri, Uyarılar) düzenlenmiştir, hızlı ayarlamalar için.
- Bireysel görsel öğelerin görünürlüğünü açıp kapatın: MACD ve Sinyal çizgileri, Histogram, Kesişim Sinyalleri ve Etiketler.
- Grafik estetiğinize ve tercihinize mükemmel uyum için ayarlanabilir sinyal ofseti.
Özet
Key features include dynamic coloring of the MACD and signal lines to indicate bullish or bearish momentum, a crystal-clear histogram that visualizes the divergence between MACD and its signal line with color-coded bars, and unmistakable visual crossover signals marked by distinct dots or arrows on the price chart. The indicator supports integrated alerts with popup and sound notifications for buy and sell signals, configurable via a streamlined settings interface.
Users can fully customize the indicator by adjusting Fast EMA, Slow EMA, and Signal Line lengths, toggling visibility of visual elements (lines, histogram, signals, labels), and modifying colors and line thickness. The settings are organized into intuitive categories for ease of use. This indicator supports a wide range of timeframes from minutes to monthly and is suitable for various markets including Forex, indices, commodities, stocks, and cryptocurrencies.
Müşteri değerlendirmeleri
5 | 100 % | |
4 | 0 % | |
3 | 0 % | |
2 | 0 % | |
1 | 0 % |


