RSI Indicator
Gösterge
Sürüm 1.0, May 2026
Windows, Mac
Trading product for RSI Indicator Gösterge SMA RSI, image 2
Trading product for RSI Indicator Gösterge SMA RSI, image 3
89
Satışlar
149
Ücretsiz yüklemeler

Açıklama

Vitrin:


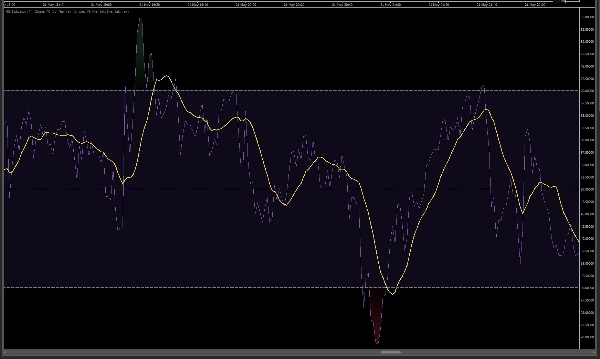
RSI Göstergesi - bu gösterge, cTrader platformu için klasik Göreceli Güç Endeksi (RSI) osilatörünün gelişmiş ama temiz bir uygulamasıdır. TradingView'in orijinal göstergesine (resmi spesifikasyonlarına dayanarak) tam uyumlu olarak geliştirilmiştir.

RMA (Çalışan Hareketli Ortalama) yumuşatma modeli kullanımı sayesinde, bu gösterge TradingView muadiliyle tamamen aynı şekilde davranır ve çizer. Ayrıca tamamen eşleşen görsel deneyim sağladık.

Ana özellikler ve fonksiyonlar:

  • %100 TradingView Uyumluluğu: Algoritma, orijinal TV göstergesiyle tamamen aynı hesaplama mantığını kullanır (RMA formülüne dayanır).
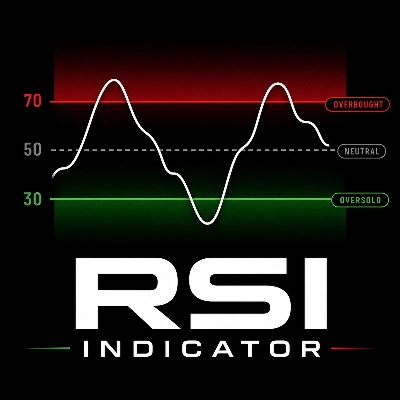
  • Çarpıcı Görsel Tasarım (Dinamik Gradyanlar): Yenilikçi 30 seviyeli renk gölgeleme sistemi uygulanmıştır. RSI aşırı alım bölgesine (70 üzeri) çıktıkça kırmızı arka plan daha yoğun hale gelir. Aşırı satım bölgesine (30 altı) düştükçe yeşil ton derinleşir. Orta aralık klasik mor tonu korur.
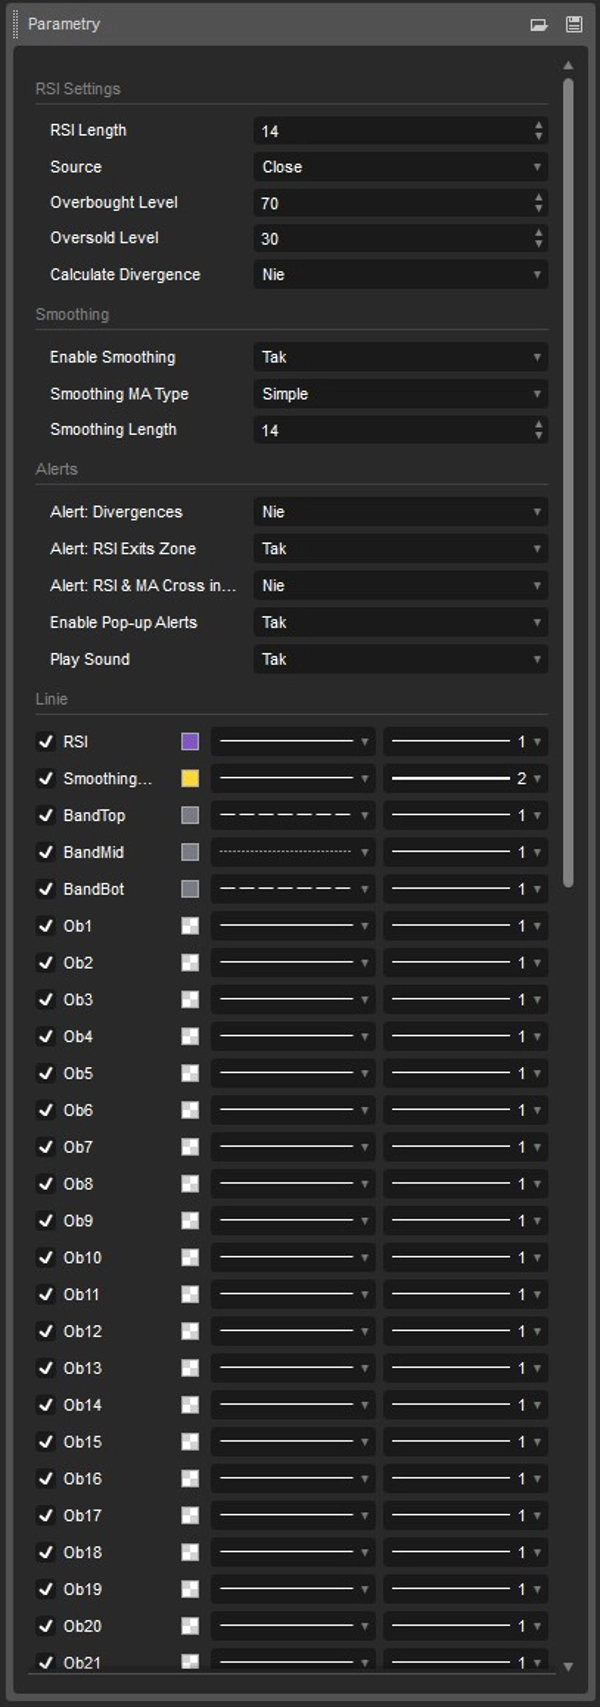
  • Yerleşik Hareketli Ortalama (MA): En son TV sürümlerinde olduğu gibi, RSI çizgisini yumuşatan ve osilatör içindeki trendleri belirlemeye yardımcı olan hareketli ortalama çizgisini (örneğin SMA) etkinleştirebilirsiniz.
  • Otomatik Uyumsuzluk Tespiti: Gösterge, grafikte düzenli uyumsuzlukları otomatik olarak tarayabilir. Fiyat ve RSI trend gücü arasında uyumsuzluk tespit ettiğinde, göstergenin penceresinde doğrudan çizgiler ve işaretler (Boğa: yeşil, Ayı: kırmızı) çizer.
  • Güçlü Uyarı Sistemi (Pop-up & Ses): Her zaman güncel kalın. Gösterge sizi şu durumlarda bilgilendirir:
    • RSI aşırı alım/aşırı satım bölgelerinden çıkar (klasik al/sat sinyalleri üretir),
    • RSI çizgisi bu bölgelerde derinlemesine MA çizgisini keser,
    • Yeni bir uyumsuzluk tespit edilir.

Bu gösterge kimler için?

TradingView'de RSI analizine alışkınsanız, cTrader'da tamamen eşleşen sinyaller arıyorsanız ve temiz, görsel olarak çekici bir tasarımı (renkleri manuel ayarlamadan) önemsiyorsanız, bu gösterge ideal bir çözümdür.

Kullanımı basit, işlemi hassas ve orijinale sadık!

cGuru

Özet

YZ özeti
The RSI Indicator is a cTrader implementation of the classic Relative Strength Index oscillator, designed to replicate TradingView’s original indicator using the Running Moving Average (RMA) smoothing method. It provides 100% calculation compatibility with TradingView, ensuring identical signal behavior and visual presentation. Key features include a dynamic 30-level gradient color scheme that visually distinguishes overbought (red) and oversold (green) zones, with a neutral purple mid-range. The indicator supports an optional moving average line (e.g., SMA) to smooth the RSI curve and highlight trends within the oscillator. It also offers automatic detection of regular divergences between price and RSI trends, marking bullish and bearish divergences directly on the chart. A built-in alert system notifies users via pop-up and sound when the RSI exits overbought/oversold zones, crosses the moving average within these zones, or when new divergences are detected. This indicator is suitable for traders familiar with TradingView’s RSI who seek an accurate, visually clear, and feature-rich RSI tool within the cTrader platform.
Gösterge profili
Gösterge kategorisi
Destek ve direnç
Çıktı türü
Görselleştirme
Veri gereklilikleri
Tick verisi
Desteklenen sinyaller
Yön değiştirme
Sapma

Müşteri değerlendirmeleri

0.0
Değerlendirmeler: 0
Müşteri değerlendirmeleri
Bu ürün için henüz bir değerlendirme yok. Ürünü denediniz mi? O zaman ona dair görüşlerini paylaşan ilk kişi olun!

Tartışma

SSS

SMA
RSI
Moving Average
cTrader Store üzerinden erişilebilen işlem botları, göstergeler ve eklentiler gibi ürünler, üçüncü taraf sağlayıcılar tarafından sağlanır ve yalnızca bilgilendirme ve teknik erişim amaçlarıyla sunulur. cTrader Store bir broker değildir ve yatırım tavsiyesi, kişisel öneriler vermez veya gelecekteki performansı garanti etmez.

Bu oluşturanın diğer ürünleri

Gösterge
AI
ATR
+27
Trend Is Your Friend cBot - INDICATOR - Professional Grid, Pyramid, Swing & Scalp Trading Indicator
Gösterge
AI
ATR
+27
Supertrend Indicator
Gösterge
AI
ATR
+27
Nadaraya-Watson Envelope Indicator
Gösterge
AI
ATR
+27
Market Cipher B
Gösterge
AI
ATR
+27
Supertrend Indicator
Gösterge
AI
ATR
+26
MacD Custom Indicator-Multiple Time Frame
cBot
AI
ATR
+27
RSI Simple Grid cBot - grid trading strategy with RSI (Relative Strength Index) signals
26.8%
ROI
4.41
Kâr faktörü
Gösterge
AI
ATR
+19
Market Cipher A
cBot
AI
ATR
+27
SmartHedge cBot - Your Trading Companion
1.26
Kâr faktörü
cBot
ATR
RSI
+5
Trend is your friend cBot - Professional Grid, Pyramid, Swing & Scalp Trading System
28%
ROI
5.27
Kâr faktörü
Gösterge
EMA
SMA
+3
MACD indicator modeled after TradingView, featuring a 4-color momentum histogram, sound/pop-up crossover alerts.

Şunları da beğenebilirsiniz

"UT Bot" logosu
Popüler
4.6
(3)
$19
/
$20
Gösterge
ATR
Forex
+11
Trend-following indicator with dynamic ATR-based trailing stop for precise entry/exit signals
Gösterge
Overlay HTF context on any chart: color bars by HTF and draw filled HTF bodies with optional High/Low lines.
Gösterge
VWAP
Volume
+3
Don't trust static support and resistance levels, this indicator combines Fibonacci and VWAP in one powerful tool.
Gösterge
Forex
Customizable multi-timeframe pivot point indicator for cTrader with alerts, Fibonacci, CPR, and more!
Gösterge
ADX
ATR
+5
10 Factors. One Signal. Zero Guesswork.
Gösterge
SMC
Forex
+5
The only cTrader FVG indicator with Breakaway Gap detection, mitigation tracking, and full multi-asset compatibility.
Gösterge
Key Levels
Liquidity Sweep
Professional Opening Range Breakout, Initial Balance, False breakout Detection
Gösterge
Alpha Sentiment Pro - See the Market's Pulse Before It Moves
Gösterge
Key Levels
Liquidity Grab
+3
Visual market context dashboard showing bias states, CE positioning, session status and sweep context.
Gösterge
AI
ATR
+9
Index Hunter: Momentum analysis for US30 & NAS100. Designed to identify high-velocity moves and intraday trends.
Gösterge
Forex
BTCUSD
+4
This indicator is designed to perform multiple non-linear regression analysis using four independent variables.
Gösterge
Prop
Forex
+12
Identify and trade breakouts with Consolidation Zones! Visualize price consolidation areas for trading opportunities.
Gösterge
AI-assisted
Order Block
+5
The daily bias estimator indicator uses ICT concepts to show whether the chart is bullish or bearish on multi-time frame
Gösterge
BOS
MSS
+3
Orderblocks with Multi-Timeframe.
Gösterge
AI
RSI
+18
Session boxes with UTC offset, OR logic, adjustable opacity, and multi-day lookback.
Gösterge
Highlights market sessions & overlaps with real-time range & volume stats – perfect for pro scalpers.
Gösterge
Forex
BTCUSD
+4
The Linear Regression Oscillator (LRO) is a technical indicator based on linear regression analysis.
Gösterge
AI
ATR
+26
Liquidity Cluster Order automatically detects and draws accumulation zones & distribution zones

Fiyat

89
Satışlar
149
Ücretsiz yüklemeler