
LT_SmartSwings
Indicator
6 purchases
Version 1.0, Jun 2025
Windows, Mac
5.0
Reviews: 1
Description
Note: Tested on cTrader Windows only.
LT_SmartSwings is a powerful swing-based market structure indicator designed to help traders visualize key turning points, market moves, and breakout events with clarity and flexibility. Built for precision and adaptability, this tool is ideal for traders who rely on swing logic, Fibonacci confluence, and breakout analysis.
Core Features:
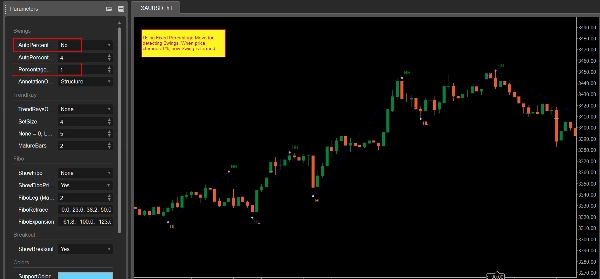
- Swing High/Low Detection based on price movement percentage
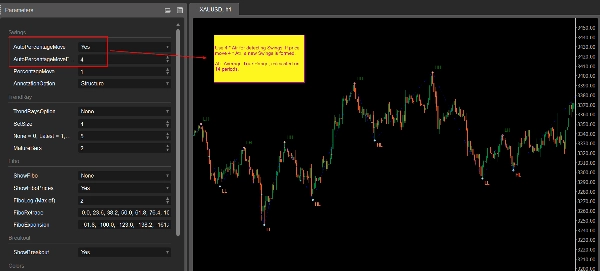
- Auto or Manual Threshold: Use fixed % or auto mode (based on ATR x factor)
- ZigZag Line connecting key swings
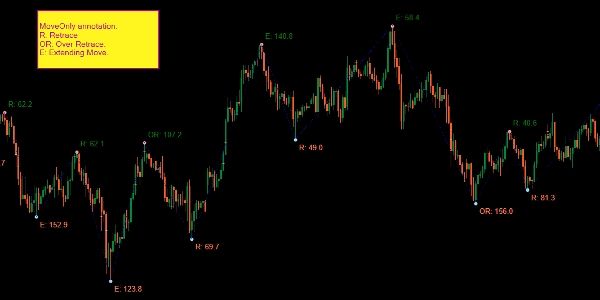
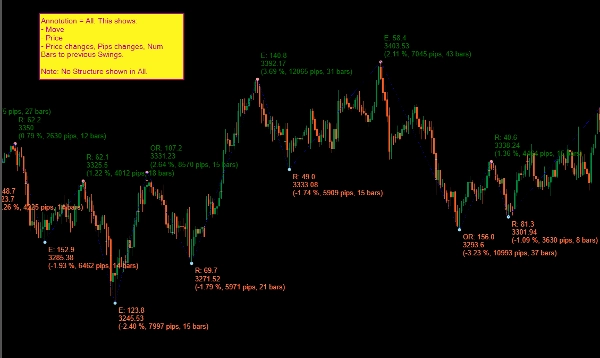
- Detailed Annotations with 5 modes:
- Structure: HH, HL, LH, LL
- MoveOnly: Retrace (R) and Extension (E) percentages
- PriceOnly
- MoveNPrice
- All: move %, pips, bars, price, move type
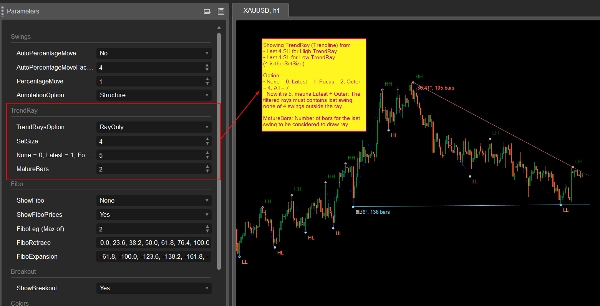
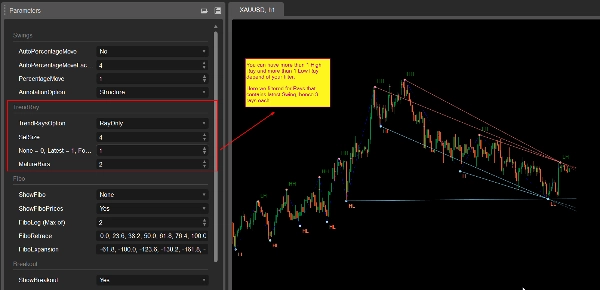
- Trend Ray Projection (with multiple filtering options):
- Draws rays from recent swings using smart constraints
- Options: Latest, Focus (slope), Outer, or All
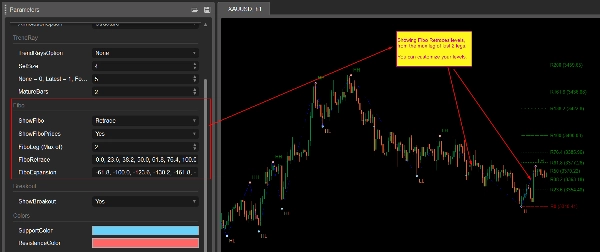
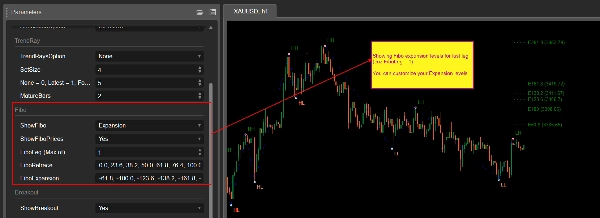
- Automatic Fibonacci Levels:
- Draws Retracement or Expansion levels based on recent moves
- User-configurable level sets
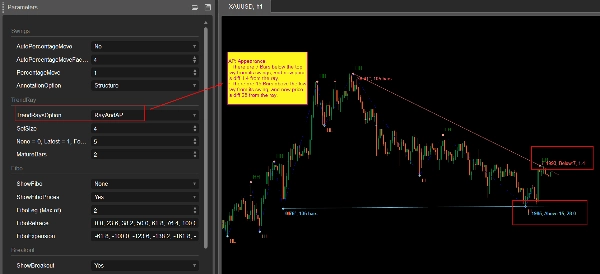
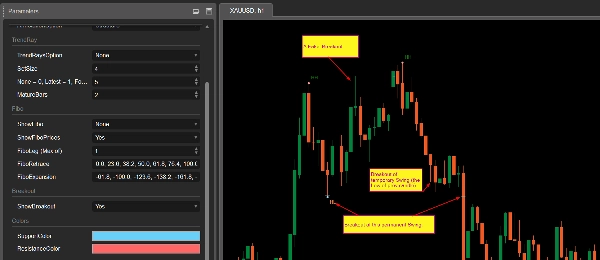
- Breakout Marking:
- Detects breakout of swing points (both confirmed and false breakouts)
- Persistent display for historical reference
- Color Customization for support/resistance lines
Use Cases:
- Identify support/resistance dynamically
- Understand swing structure and transitions
- Spot trend continuation or reversal using Fibs
- Visualize breakout points for trade planning
- Combine with your existing systems or discretionary strategy
Recommended Use:
- Attach to your working timeframe (e.g., M30, H1)
- Best suited for manual traders, structure analysts, and confirmation-based strategies
Launch Offer: Available now for only $15!
Summary
AI summary
LT_SmartSwings is a swing-based market structure indicator designed for traders to identify key turning points, market moves, and breakout events with precision and flexibility. It detects swing highs and lows based on price movement percentage, using either fixed or automatic thresholds derived from ATR. The indicator connects key swings with a ZigZag line and provides detailed annotations in five modes, including structure (HH, HL, LH, LL), move percentages, price-only, combined move and price, and comprehensive move data.
Additional features include trend ray projection with multiple filtering options, automatic Fibonacci retracement and expansion levels customizable by the user, and breakout marking that detects both confirmed and false breakouts with persistent historical display. Support and resistance lines can be color-customized.
Use cases cover dynamic support/resistance identification, understanding swing structure and transitions, spotting trend continuation or reversal via Fibonacci levels, visualizing breakout points for trade planning, and integration with existing trading systems or discretionary strategies. It is recommended for manual traders, structure analysts, and confirmation-based strategies, and is intended for use on working timeframes such as M30 or H1. The indicator has been tested on cTrader Windows.
Indicator profile
Customer reviews
5.0
Reviews: 1
5 | 100 % | |
4 | 0 % | |
3 | 0 % | |
2 | 0 % | |
1 | 0 % |
Discussion
FAQ
Breakout
ATR
Products available through cTrader Store, including trading bots, indicators and plugins, are provided by third-party developers and made available for informational and technical access purposes only. cTrader Store is not a broker and does not provide investment advice, personal recommendations or any guarantee of future performance.


Price
Since 25/09/2024
34
Sales