
AnchoredVWAP
Indicator
5 purchases
Version 1.0, Sep 2025
Windows, Mac
5.0
Reviews: 3
Description
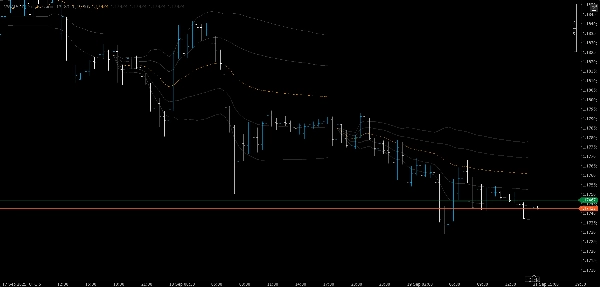
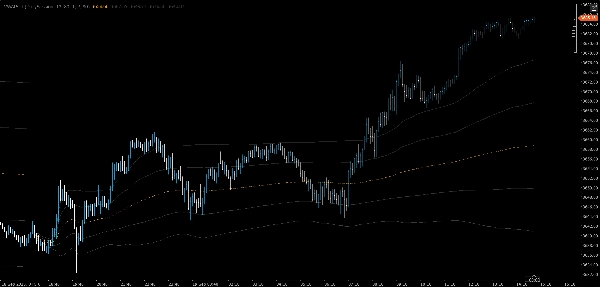
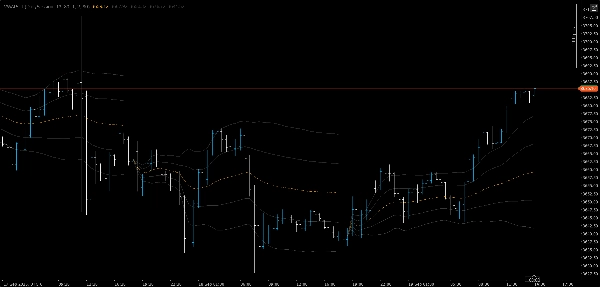
🧭 Anchored VWAP+ | Volatility Envelope Edition
Anchored VWAP+ is a precision overlay tool that combines session-aware VWAP logic with dynamic ±1σ and ±2σ standard deviation bands. Designed for traders who rely on volume-weighted bias and volatility zones, this indicator offers full control over anchoring and envelope width.
🔹 Key Features
- Custom Anchoring Logic
Reset VWAP at the start of each session, New York open, or any user-defined UTC time. Anchoring is clean and discontinuous, ensuring regime clarity. - Volatility Envelope with Dual k Parameters
Plot four adaptive bands: ±1σ and ±2σ, each controlled by its ownkmultiplier. Fine-tune the envelope width to match your strategy’s sensitivity. - Discontinuous VWAP Line
VWAP resets visually at each anchor point, avoiding misleading continuity across sessions.
⚙️ Parameters
Anchor TypeCustom Hour/Minutek1k2Line Opacity
Whether you're trading breakouts, reversion, or volatility compression, Anchored VWAP+ gives you the clarity, control, and visual precision to act with confidence.
Let me know if you'd like a matching tagline, icon set, or suite badge to go with it. We can brand this like a flagship.
Summary
AI summary
Anchored VWAP+ is a precision trading indicator that overlays a volume-weighted average price (VWAP) with dynamic volatility envelopes. It features session-aware VWAP logic that resets at customizable anchor points, such as the start of each trading session, the New York open, or any user-defined UTC time. This discontinuous VWAP line ensures clear regime separation without misleading continuity across sessions.
The indicator plots four adaptive bands representing ±1 and ±2 standard deviations, each adjustable via independent multiplier parameters (k1 and k2). This allows traders to fine-tune the volatility envelope width to align with their specific trading strategies. Key parameters include anchor type, custom hour and minute settings, and line opacity control.
Designed for markets including Forex (e.g., EURUSD), indices, and commodities like gold (XAUUSD), Anchored VWAP+ supports trading styles such as breakout and scalping. It provides visual clarity and control over volume-weighted bias and volatility zones, aiding decision-making in breakout, reversion, or volatility compression scenarios.
Indicator profile
Customer reviews
5.0
Reviews: 3
5 | 100 % | |
4 | 0 % | |
3 | 0 % | |
2 | 0 % | |
1 | 0 % |
Customer reviews
September 24, 2025
Solid planning tool around volume based context. The useful part is checking participation, value areas and pressure, with the numbers checked before scaling. I would review 20 reactions near POC or VWAP before trusting the read. The data helps most when price action confirms the same zone.
September 23, 2025
September 23, 2025
Simple risk companion if the trader wants it adds useful information behind the price move. It works best as support, not a final decision maker. Volume context is stronger when POC, VWAP and value area agree across 2 sessions. volume alone can be noisy without price action.
Discussion
FAQ
Forex
Breakout
Scalping
Indices
EURUSD
XAUUSD
Products available through cTrader Store, including trading bots, indicators and plugins, are provided by third-party developers and made available for informational and technical access purposes only. cTrader Store is not a broker and does not provide investment advice, personal recommendations or any guarantee of future performance.


Price
26
Sales
2.13K
Free installs