
Fractals
อินดิเคเตอร์
2 การซื้อ
เวอร์ชัน 1.0, Aug 2025
Windows, Mac
4.0
รีวิว: 2
คำอธิบาย
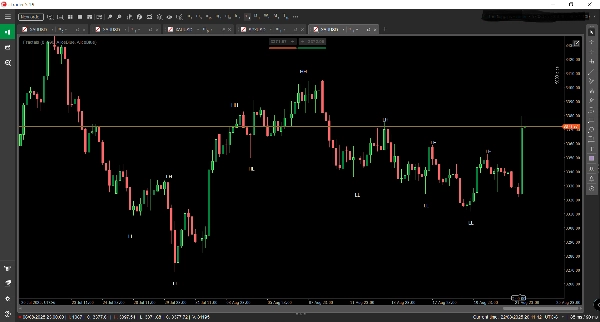
🧠 แฟรคทัล – โครงสร้างตลาดที่มองเห็นได้
แฟรคทัล คืออินดิเคเตอร์การเทรดที่ออกแบบอย่างแม่นยำสำหรับ cTrader ที่เปิดเผยสถาปัตยกรรมที่ซ่อนอยู่ของการเคลื่อนไหวของราคา โดยการตรวจจับและติดป้าย Higher Highs (HH), Higher Lows (HL), Lower Highs (LH), และ Lower Lows (LL) โดยอัตโนมัติบนชาร์ต แฟรคทัลเปลี่ยนข้อมูลราคาดิบให้เป็นแผนที่โครงสร้างตลาดที่ชัดเจนและนำไปใช้ได้จริง
🔍 คุณสมบัติหลัก:
- การทำแผนที่โครงสร้างแบบเรียลไทม์: ระบุจุดสวิงและติดป้ายทันทีเพื่อเปิดเผยทิศทางแนวโน้มและโซนกลับตัว
- การรับรู้หลายกรอบเวลา: ออกแบบมาเพื่อเน้น โครงสร้างมหภาค บนกรอบเวลาที่สูงกว่า ให้ผู้เทรดได้เปรียบเชิงกลยุทธ์ในการจัดตำแหน่งการเข้าเทรดกับแนวโน้มหลัก
- การปรับแต่งสำหรับการติดตามแนวโน้ม: เหมาะสำหรับผู้เทรดที่ใช้ กลยุทธ์โมเมนตัม, เบรคเอาท์ หรือ พูลแบ็ค ช่วยยืนยันความเอนเอียงและหลีกเลี่ยงกับดักแนวโน้มสวนทาง
- การแสดงผลภาพที่สะอาดตา: การบันทึกบนชาร์ตที่สวยงามซึ่งผสานรวมอย่างลงตัวกับการตั้งค่าการเทรดใด ๆ เพิ่มความชัดเจนโดยไม่รก
🧭 กรณีการใช้งาน:
- สังเกตแนวโน้มที่เกิดขึ้นใหม่และการเปลี่ยนแปลงโครงสร้างก่อนที่จะชัดเจน
- ยืนยันการตั้งค่าการเทรดด้วยการยืนยันโครงสร้าง
- ผสมผสานกับค่าเฉลี่ยเคลื่อนที่, ปริมาณ หรืออินดิเคเตอร์ที่กำหนดเองเพื่อความสอดคล้องหลายชั้น
- เหมาะสำหรับ การทดสอบย้อนหลังด้วยตนเอง และ การประเมินผลบริษัทโปรพ ที่ตรรกะบนพื้นฐานโครงสร้างเป็นกุญแจสำคัญ
สรุป
สรุปโดย AI
Fractals is a trading indicator designed for the cTrader platform that visualizes market structure by automatically detecting and labeling key price action points: Higher Highs (HH), Higher Lows (HL), Lower Highs (LH), and Lower Lows (LL). It provides real-time mapping of swing points to reveal trend direction and potential reversal zones. The indicator supports multi-timeframe analysis, emphasizing macro structure on higher timeframes to help align trades with dominant market trends. Fractals is optimized for momentum, breakout, and pullback strategies, assisting traders in confirming bias and avoiding counter-trend trades. Its clean visual overlay integrates smoothly with existing chart setups, enhancing clarity without clutter. Use cases include spotting emerging trends and structural shifts early, validating trade setups with structural confirmation, combining with other indicators like moving averages or volume for layered analysis, and supporting manual backtesting and prop firm evaluations where market structure is critical. The indicator applies across various markets including Forex, indices, commodities, cryptocurrencies, and stocks.
โปรไฟล์อินดิเคเตอร์
รีวิวจากลูกค้า
4.0
รีวิว: 2
5 | 0 % | |
4 | 100 % | |
3 | 0 % | |
2 | 0 % | |
1 | 0 % |
รีวิวจากลูกค้า
August 31, 2025
it gives the trade idea another check, but the result needs a journal.
August 27, 2025
การสนทนา
คำถามที่พบบ่อย
Prop
Forex
Indices
Commodities
Crypto
Stocks
ผลิตภัณฑ์ที่มีให้บริการผ่าน cTrader Store รวมถึงบอทการเทรด อินดิเคเตอร์ และปลั๊กอิน มีให้บริการโดยนักพัฒนาบุคคลที่สามและมีไว้เพื่อวัตถุประสงค์ในการเข้าถึงข้อมูลและทางเทคนิคเท่านั้น cTrader Store ไม่ใช่โบรกเกอร์และไม่ได้ให้คำแนะนำการลงทุน คำแนะนำส่วนบุคคล หรือการรับประกันผลการดำเนินงานในอนาคต


ราคา
26
การขาย
2.18K
ติดตั้งฟรี