
คำอธิบาย
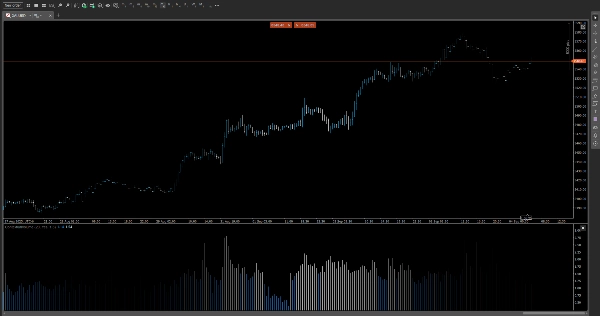
📊 ปริมาณสัมพัทธ์ภายในวัน (RVI)
สังเกตการเพิ่มขึ้นของปริมาณที่สำคัญ—เมื่อมันสำคัญ
RVI คือดัชนีที่ออกแบบอย่างแม่นยำเพื่อเปรียบเทียบปริมาณปัจจุบันกับค่าเฉลี่ยในอดีตสำหรับช่วงเวลาเดียวกันของวัน เผยให้เห็นโมเมนตัมและการเปลี่ยนแปลงสภาพคล่องที่ซ่อนอยู่ในช่วงเวลาภายในวัน
🔍 คุณสมบัติหลัก
• การวิเคราะห์ปริมาณตามช่วงเวลาในวัน
คำนวณปริมาณเฉลี่ยต่อช่วงเวลา (เช่น 10:15 น.) ในช่วงเวลาที่ผ่านมา ให้คุณมีมาตรฐานเปรียบเทียบสำหรับแต่ละแท่งเทียน
• รองรับหลายกรอบเวลา
ทำงานได้อย่างราบรื่นตั้งแต่ กราฟ 5 นาที ถึง กรอบเวลา 12 ชั่วโมง ปรับให้เข้ากับสไตล์การเทรดของคุณ—สเกลปิ้ง, สวิง หรือแบบตามช่วงเวลา
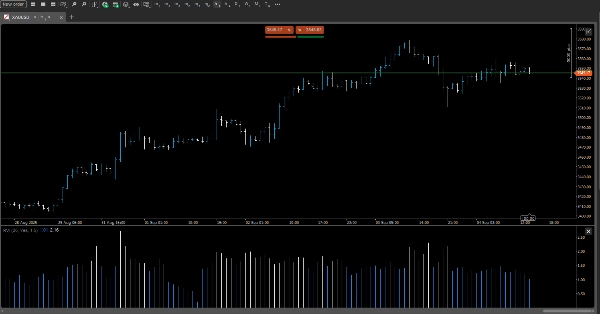
• การใช้สีแบบไดนามิก
เน้นแท่งเทียนที่มีปริมาณสูงกว่าค่าเฉลี่ยโดยใช้เกณฑ์สีที่ปรับแต่งได้ สังเกตโซนกิจกรรมสูงได้ทันทีด้วยสัญญาณภาพที่เข้าใจง่าย
• โหมดอัตราส่วนกับความแตกต่าง
เลือกมาตรวัดที่คุณชอบ:
• โหมดอัตราส่วน: แสดงปริมาณปัจจุบัน ÷ ปริมาณเฉลี่ย (เช่น 2.3×)
• โหมดความแตกต่าง: แสดงการเบี่ยงเบนสัมบูรณ์ (เช่น +1,200 สัญญา)
• แสดงผลแบบซ้อนหรือแผงด้านข้าง
สลับระหว่างการซ้อนกราฟในบรรทัดหรือแผงด้านข้างขนาดกะทัดรัดเพื่อการผสานรวมที่สะอาดตากับเลย์เอาต์ที่คุณมีอยู่
🎯 กรณีการใช้งาน
• ยืนยันความแข็งแกร่งของการเบรกเอาต์ด้วยการเพิ่มขึ้นของปริมาณเมื่อเทียบกับกิจกรรมปกติ
• กรองสัญญาณเท็จในช่วงเวลาที่ปริมาณต่ำ
• ระบุร่องรอยของสถาบันในช่วงเวลาสำคัญภายในวัน
• ปรับปรุงกลยุทธ์ที่ใช้ปริมาณด้วยบริบทที่รับรู้เวลามากขึ้น
⚙️ ตัวเลือกการปรับแต่ง
• ช่วงเวลาย้อนหลังที่ปรับได้สำหรับการคำนวณค่าเฉลี่ยในอดีต
• เกณฑ์สีที่ผู้ใช้กำหนดเองสำหรับความเข้มของปริมาณ
• สลับโหมดการแสดงผล (อัตราส่วน/ความแตกต่าง)
• เข้ากันได้กับธีมมืด/สว่าง
สรุป
รีวิวจากลูกค้า
5 | 100 % | |
4 | 0 % | |
3 | 0 % | |
2 | 0 % | |
1 | 0 % |


