
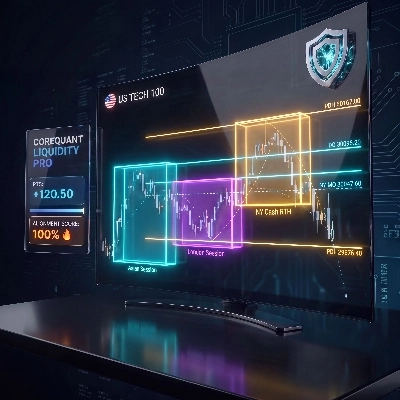
CoreQuant_Liquidity_Map_Pro
อินดิเคเตอร์
2 การซื้อ
เวอร์ชัน 2.0, Aug 2026
Windows, Mac

2
การขาย
20
ติดตั้งฟรี
คำอธิบาย
⚡ CoreQuant Nasdaq Liquidity Map Pro — กรอบการดำเนินงาน Institutional NQ Session & ICT
ควบคุมการไหลของคำสั่งสถาบันและเทรดการกวาดสภาพคล่องที่มีความน่าจะเป็นสูงด้วย CoreQuant Nasdaq Liquidity Map Pro — ชุดเครื่องมือแผนที่เซสชันอัตโนมัติและการดำเนินงาน ICT/SMC แบบครบวงจรที่ออกแบบมาเฉพาะสำหรับ Nasdaq (NQ, US100, USTEC) และเทรดเดอร์ดัชนีบน cTrader.
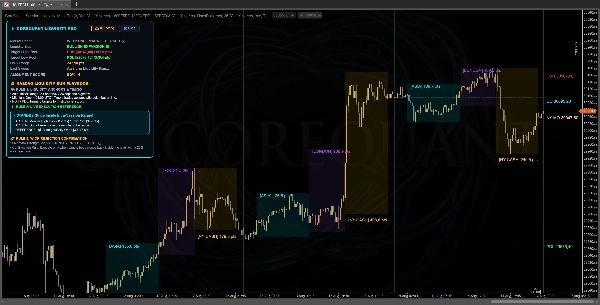
ขจัดการเตรียมชาร์ตด้วยตนเอง CoreQuant คำนวณช่วงเซสชันแบบไดนามิกโดยอัตโนมัติ โปรเจกต์รังสีสภาพคล่องแนวนอนเข้าสู่การเปิดตลาดนิวยอร์ก และส่งมอบเมตริกการดูดซับไส้เทียนแบบเรียลไทม์ผ่าน HUD บนชาร์ตแบบโต้ตอบได้
🎯 คุณสมบัติหลักของสถาบัน
- เครื่องยนต์จุด Nasdaq 100% เนทีฟ (
pts): ช่วงเซสชันทั้งหมด ระยะทางพูลเป้าหมาย และเมตริกความเสี่ยงแบบไดนามิกถูกคำนวณโดยตรงในจุดดัชนี — ไม่มีความสับสนเรื่อง pip - กล่องสภาพคล่อง 3 เซสชันอัตโนมัติ:
-
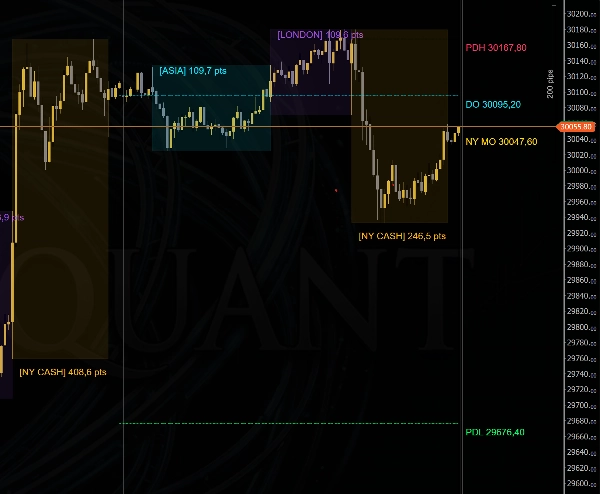
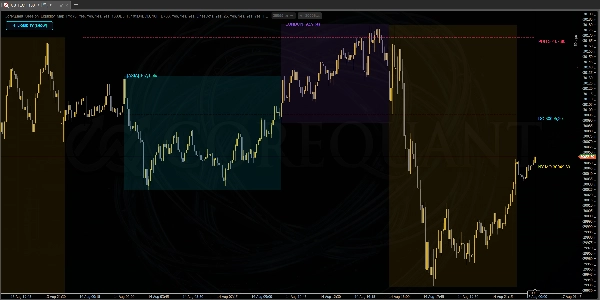
- ช่วงสะสมเอเชีย (00:00–08:00 UTC): แสดงขอบเขตสภาพคล่องเริ่มต้น
- ช่วงเซสชันลอนดอน (08:00–13:30 UTC): ติดตามการจัดการก่อนตลาดและการวิ่งสภาพคล่อง
- กล่อง New York Cash RTH (13:30–20:00 UTC): เน้นหน้าต่างปริมาณหลักของ Wall Street
- รังสีสภาพคล่องเซสชันขยาย: โปรเจกต์แนวนอนแบบไดนามิกที่ขยายจุดสูงสุดและต่ำสุดของเซสชันโดยตรงเข้าสู่การเปิดตลาดนิวยอร์กเพื่อระบุพูลที่ยังไม่ได้รับการจัดการ
- จุดยึด ICT วันจริง (เปิดเที่ยงคืน NY): แผนภูมิราคาการเปิด 04:00 UTC (00:00 EST) โดยอัตโนมัติเพื่อแยกการสะสมภายในวัน (ส่วนลด) จากการกระจาย (พรีเมียม)
- ระดับกุญแจสถาบันที่มีขอบเขต: เส้นแนวโน้มความแม่นยำสำหรับ Previous Day High (PDH), Previous Day Low (PDL), และ Daily Open (DO) ที่ยึดติดอย่างเคร่งครัดกับจุดเริ่มต้นเซสชันรายวัน
- เครื่องยนต์ดูดซับไส้เทียนสด: การตรวจจับทางคณิตศาสตร์แบบเรียลไทม์ของการกวาดสภาพคล่องที่ต้องการการปฏิเสธไส้เทียนอย่างน้อย $\ge 25\%$ เพื่อป้องกันการเข้าซื้อก่อนเวลา
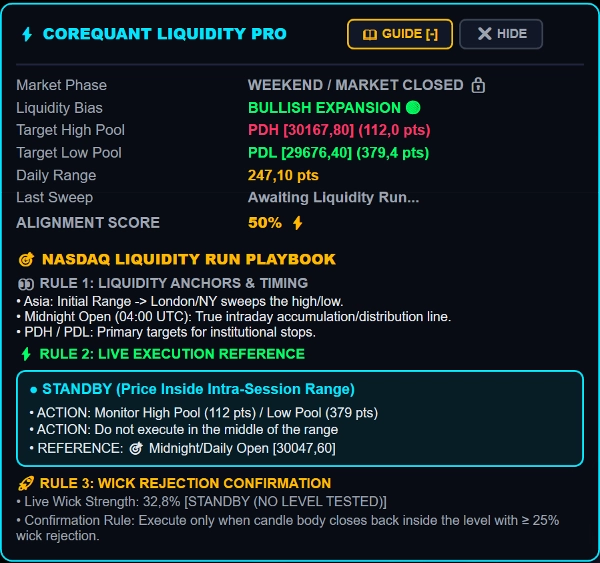
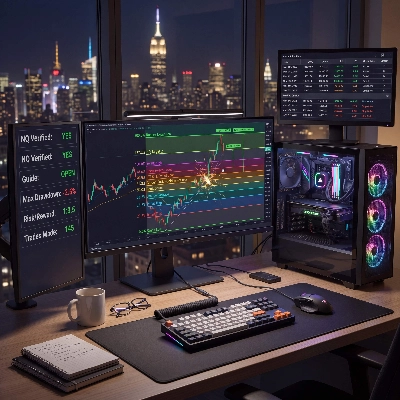
- HUD การดำเนินงานแบบโต้ตอบบนหน้าจอ: ตัวตรวจจับเฟสตลาด Nasdaq แบบเรียลไทม์, อคติสภาพคล่องแบบไดนามิก, ตัวติดตามระยะทางถึงพูลแบบสด, และคะแนนการจัดตำแหน่ง (%)
- เทอร์มินัลยุบได้ด้วยคลิกเดียว: สลับทันทีระหว่างสมุดเล่น 3 ขั้นตอนที่ขยาย, HUD ขนาดกะทัดรัด, หรือย่อเป็นปุ่มมินิ
⚡ LIQUIDITY [SHOW]ที่ดูเรียบง่าย
📖 วิธีการเทรดตาม NASDAQ PLAYBOOK
- ขั้นตอนที่ 1: ระบุพูลเป้าหมายหลัก
ติดตามการขยายราคาสู่ขอบเขตสภาพคล่องที่ยังไม่ได้รับการจัดการ (PDH, PDL, Asia High/Low, หรือ London Extremes) ในช่วง NY Pre-Market และ Opening Drive - ขั้นตอนที่ 2: อ้างอิงการตั้งค่าแบบสด & การจัดตำแหน่งอคติ
-
- อคติขาขึ้น (เหนือการเปิดเที่ยงคืน NY): มองหาการกวาดต่ำ / การกลับตัวที่จุดต่ำสุดของเซสชันหรือ PDL
- อคติขาลง (ต่ำกว่าการเปิดเที่ยงคืน NY): มองหาการกวาดสูง / การลดลงที่จุดสูงสุดของเซสชันหรือ PDH
- แผนที่เป้าหมาย: อ้างอิงกำไรแบบไดนามิกที่ยึดติดกับการเปิดเที่ยงคืน NY หรือ Daily Open
- ขั้นตอนที่ 3: ยืนยันไส้เทียน & การดำเนินงาน
ดำเนินการเฉพาะเมื่อราคากวาดระดับและตัวแท่งเทียนปิดกลับภายในขอบเขตด้วยการปฏิเสธไส้เทียนที่ได้รับการยืนยัน $\ge 25\%$
⚙️ พารามิเตอร์ที่ปรับแต่งได้
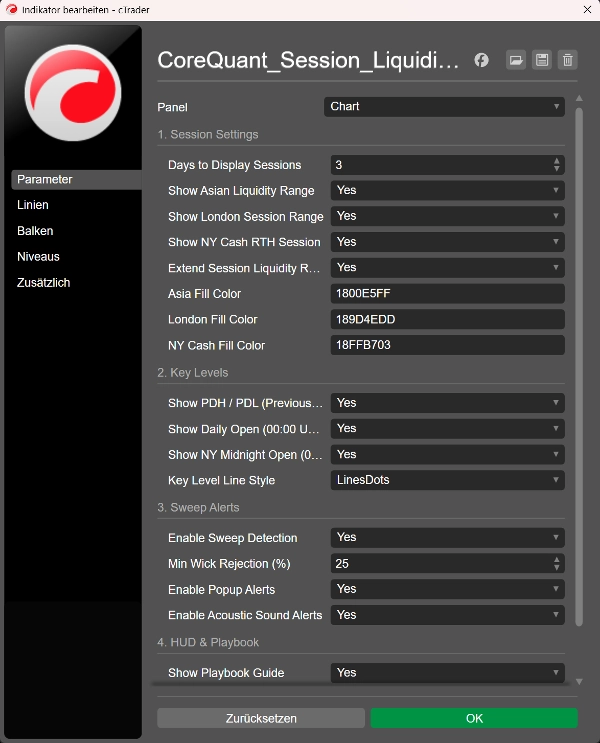
- ความลึกประวัติของเซสชัน: ปรับการย้อนดูประวัติจาก 1 ถึง 10 วันทำการ (ค่าเริ่มต้น: 3 วัน / 1 สัปดาห์ทำการเต็ม)
- สวิตช์เปิด/ปิดเซสชัน & รังสี: สวิตช์อิสระสำหรับเอเชีย, ลอนดอน, NY Cash, และรังสีสภาพคล่องขยาย
- ระดับสถาบัน: สลับ PDH, PDL, Daily Open (00:00 UTC), และ NY Midnight Open (04:00 UTC) พร้อมสไตล์เส้นที่ปรับแต่งได้
- ความไวต่อการกวาด: ตั้งเกณฑ์การปฏิเสธไส้เทียนขั้นต่ำที่กำหนดเอง (10% ถึง 80%)
- การแจ้งเตือนทันที: ป๊อปอัพบนชาร์ตและทริกเกอร์เสียงที่ตั้งค่าได้สำหรับเหตุการณ์การกวาดแบบเรียลไทม์
- ตำแหน่งอินเทอร์เฟซ: จอด HUD ที่มุมใดก็ได้ของชาร์ต (บนซ้าย, บนขวา, ล่างซ้าย, ล่างขวา)
📦 สิ่งที่รวมอยู่
- ใบอนุญาตตลอดชีพ & การเข้าถึงทันที
- อัปเดตตลอดชีพฟรี: การปรับปรุงตัวชี้วัดในอนาคตทั้งหมด, การอัปเกรดอัลกอริทึม, และแพตช์ความเข้ากันได้กับ cTrader รวมตลอดไป
- การสนับสนุนเฉพาะตัว 1 ต่อ 1: ความช่วยเหลือโดยตรงจากนักพัฒนาสำหรับการตั้งค่า, การปรับพารามิเตอร์, และการกำหนดค่าชาร์ต
- ความหลากหลายของสินทรัพย์: ปรับเทียบโดยตรงสำหรับ US TECH 100 / NAS100, US 500, GER40, ทองคำ (XAUUSD), และ Forex
🚀 เขียนโค้ด เทรด ครองตลาด — อัปเกรดชาร์ตของคุณเป็น CoreQuant Nasdaq Liquidity Map Pro วันนี้!
สรุป
สรุปโดย AI
CoreQuant_Liquidity_Map_Pro is a professional trading indicator designed for the cTrader platform, focusing on institutional order flow and liquidity analysis using ICT and Smart Money Concepts (SMC). It dynamically maps key trading sessions—Asian, London, New York (Forex), and Wall Street (Equities)—highlighting them with clear background boxes and precise pip-range calculations. The indicator anchors critical market levels such as Previous Day High (PDH), Previous Day Low (PDL), and Daily Open to the chart’s right edge for clarity.
Key features include a live liquidity sweep engine that detects real-time sweeps of PDH and PDL with visual markers and customizable audio alerts. An interactive on-screen HUD provides session tracking, range monitoring, countdowns, and an integrated ICT liquidity trading playbook. The tool also offers smart weekend compression to reduce chart clutter while preserving essential reference levels.
Users can customize session times, toggle key levels, adjust label positioning, and configure alert sounds. The HUD layout is flexible, allowing placement in any chart corner or minimization.
This indicator is suited for traders employing Smart Money Concepts, ICT strategies, breakout/fade techniques, and price action scalping. It supports high-volatility indices (e.g., NAS100, US500, GER40), Gold (XAUUSD), Forex pairs, and cryptocurrencies, optimized for M1, M5, M15, and H1 timeframes. It accommodates both personal and prop firm challenge accounts requiring precise risk management.
โปรไฟล์อินดิเคเตอร์
หมวดหมู่อินดิเคเตอร์
โครงสร้างตลาด (SMC)
ประเภทเอาต์พุต
การแสดงเป็นภาพ
สัญญาณ
ข้อกำหนดด้านข้อมูล
แท่งเท่านั้น
สัญญาณที่รองรับ
Range ณ เวลาที่เปิดเซสชัน
เบรก Level ที่ระบุ
Reversal
แตะ Level ที่ระบุ
การสนทนา
รีวิวจากลูกค้า
0.0
รีวิว: 0
รีวิวจากลูกค้า
ยังไม่มีรีวิวสำหรับผลิตภัณฑ์นี้ หากเคยลองแล้ว ขอเชิญมาเป็นคนแรกที่บอกคนอื่น!
คำถามที่พบบ่อย
Key Levels
Pin Bar
Liquidity Sweep
Inducement
Market Structure
Liquidity Grab
Support & Resistance
ผลิตภัณฑ์ที่มีให้บริการผ่าน cTrader Store รวมถึงบอทการเทรด อินดิเคเตอร์ และปลั๊กอิน มีให้บริการโดยนักพัฒนาบุคคลที่สามและมีไว้เพื่อวัตถุประสงค์ในการเข้าถึงข้อมูลและทางเทคนิคเท่านั้น cTrader Store ไม่ใช่โบรกเกอร์และไม่ได้ให้คำแนะนำการลงทุน คำแนะนำส่วนบุคคล หรือการรับประกันผลการดำเนินงานในอนาคต
เพิ่มเติมจากผู้เขียนคนนี้













ราคา
2
การขาย
20
ติดตั้งฟรี