present
Sign up and get $50 off your first purchase
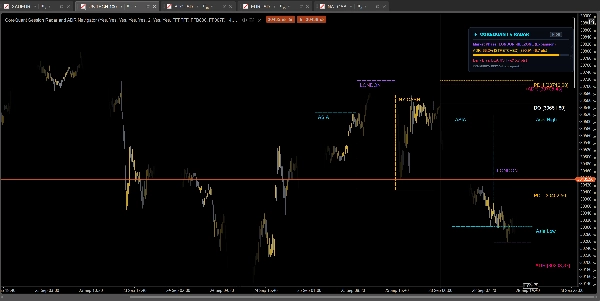
Trading product for Session Radar and ADR Navigator Indicator Key Levels Liquidity Sweep, image 1
Session Radar and ADR Navigator
Indicator
Version 1.0, Sep 2026
Windows, Mac
Trading product for Session Radar and ADR Navigator Indicator Key Levels Liquidity Sweep, image 2
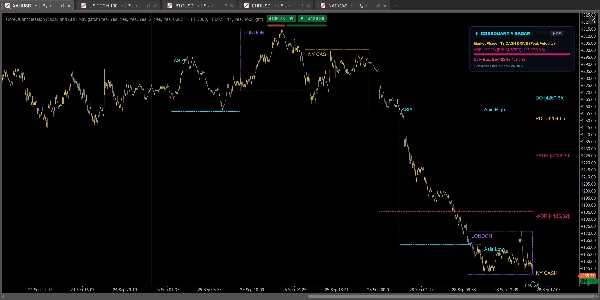
Trading product for Session Radar and ADR Navigator Indicator Key Levels Liquidity Sweep, image 3
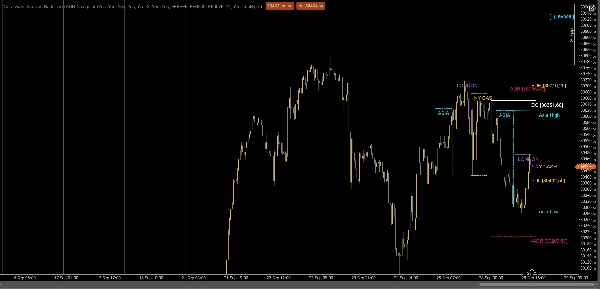
Trading product for Session Radar and ADR Navigator Indicator Key Levels Liquidity Sweep, image 4
Trading product for Session Radar and ADR Navigator Indicator Key Levels Liquidity Sweep, image 5
Trading product for Session Radar and ADR Navigator Indicator Key Levels Liquidity Sweep, image 6
2
Sales

Description

CoreQuant Session Radar & ADR Navigator

Institutional Session Mapping, Live ADR Volatility Engine & Key Level Architecture

The CoreQuant Session Radar & ADR Navigator is a high-performance market timing and volatility telemetry suite engineered specifically for cTrader. It automates essential intraday session structure, projects critical institutional liquidity levels, and dynamically calculates real-time volatility exhaustion to prevent retail overtrading and poor trade location.

1. Market Data & Structural Analysis

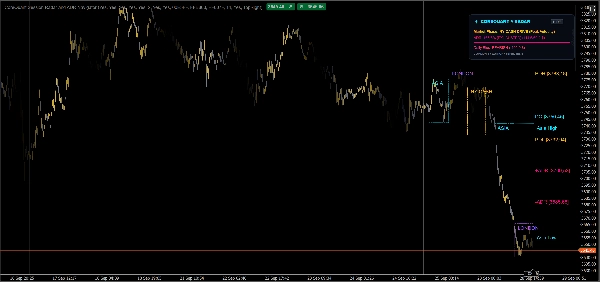
  • Automated 3-Session Geometry: Real-time visual mapping of the three major global volume phases:
    • Asian Session (00:00 – 07:00 UTC): Initial overnight balance and liquidity accumulation range.
    • London Killzone (07:00 – 13:30 UTC): Institutional expansion phase and breakout origin.
    • New York Cash Drive (13:30 – 20:00 UTC): Peak volume, directional velocity, and trend completion.
  • Asia High/Low Liquidity Projection: Automatically extends horizontal liquidity rays from the completed Asian range directly into the London session. This instantly highlights institutional liquidity runs (ICT Judas Swings) and stop sweeps.
  • Dynamic ADR Volatility Engine: Tracks the live high-to-low range against a multi-day Average Daily Range (14-period ADR by default) to establish the true statistical boundaries of the day.
  • Institutional Key Levels: Real-time forward rays anchoring Daily Open (DO), Previous Day High (PDH), and Previous Day Low (PDL) with native horizontal anti-collision staggering to prevent overlapping text labels.

2. Live Telemetry HUD & Visual Interpretation

The integrated glassmorphic HUD provides continuous on-chart orientation:

  • Market Phase Indicator: Displays the active global session in real time.
  • ADR Exhaustion Meter: Features a responsive two-color progress bar with statistical health tiers:
    • HEALTHY (< 75%): Plentiful volatility runway remains for breakout or trend continuation trades.
    • STRETCHED (75% – 100%): The market is nearing its statistical average; tighten stops and avoid chasing new entries.
    • EXHAUSTED (> 100%): The asset has expanded beyond its normal daily capacity. High probability of mean reversion, consolidation, or reversal.
  • Daily Bias Tracker: Computes tick-by-tick momentum relative to the Daily Open baseline, categorizing market direction into Bullish or Bearish expansion with point/pip distance.
  • Docking & Minimization: Complete workspace flexibility with 1-click [HIDE] toggling to collapse the panel into a compact badge, and positioning support across all four chart corners.

3. Core Parameters & Settings

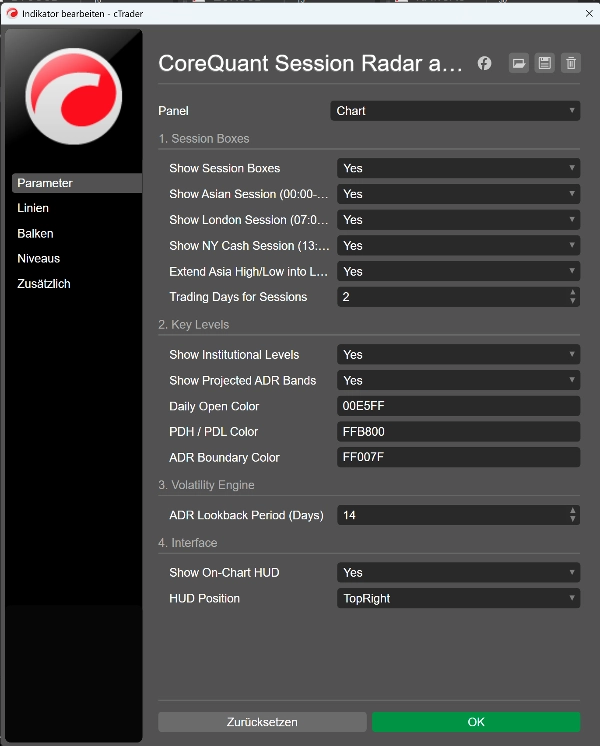
  • Session Boxes: Toggle individual sessions (ShowAsia, ShowLondon, ShowNy), customize lookback history (Trading Days for Sessions: 1–5), and enable/disable Extend Asia High/Low into London.
  • Key Levels & Boundaries: Independent controls for Daily Open, PDH/PDL, and projected 100% ADR bands (+ADR Cap / -ADR Floor), with customizable hex colors.
  • Volatility Engine: Adjustable lookback window (ADR Period: 5–50 days, default 14).
  • Workspace Positioning: Choose dock placement (TopRight, TopLeft, BottomRight, BottomLeft).

4. Primary Trading Scenarios

  • London Open Liquidity Sweeps: Monitor the extended Asian High and Asian Low dotted rays. When London spikes through the Asia level and immediately rejects back inside the range, execute mean-reversion setups toward the Daily Open.
  • ADR Exhaustion Reversals: When the ADR meter reads EXHAUSTED and price tests either the +ADR Cap or -ADR Floor, avoid entering continuation breakouts. Look for reversal patterns or take profit on existing runner positions.
  • Daily Open Equilibrium: Use the Daily Open line as the institutional dividing line: seek long setups primarily above DO and short setups primarily below DO.

5. Intended Audience & Asset Support

  • Target Users: Prop firm traders, quantitative day traders, index scalpers, and Smart Money/ICT practitioners requiring clean, non-lagging reference levels.
  • Multi-Asset Scaling: Auto-detects and scales metrics natively across all asset classes:
    • Indices (US TECH 100, US 500, GER 40): Displayed in points (pts).
    • Forex Majors & Minors: Calculated in fractional pips (pips).
    • Commodities & Crypto (Gold, BTC, ETH): Measured in currency units ($).

6. Technical Specifications & Usage Notes

  • Architecture: 100% native C# code with direct API calculations.
  • Security & Sandboxing: Configured with AccessRights = AccessRights.None. Operates strictly within the chart sandbox without external internet permissions or local file access.
  • Performance: Zero latency impact; optimized render loops prevent terminal stutter even during high-impact news releases.

CoreQuant

Code. Trade. Dominate.

Summary

Indicator profile
Indicator category
Volatility
Output type
Visualisation
Data requirements
Bars only
Supported signals
Session opening range
Volatility
Level touch
Breakout

Customer reviews

0.0
Reviews: 0
Customer reviews
No reviews for this product yet. Already tried it? Be the first to tell others!

Discussion

FAQ

Key Levels
Liquidity Sweep
Market Structure
ATR
Support & Resistance
Products available through cTrader Store, including trading bots, indicators and plugins, are provided by third-party developers and made available for informational and technical access purposes only. cTrader Store is not a broker and does not provide investment advice, personal recommendations or any guarantee of future performance.

More from this author

Multi-platform plugin
DOM Tools
Trade Alerts
+5
Institutional session HUD & real-time macro radar. Dynamic market phase tracking and automated execution barrier.
Indicator
Pin Bar
Inducement
+5
Institutional Nasdaq Session Liquidity Map with Live Point HUD, Sweep Alerts & Interactive Playbook.
Indicator
EMA
Channel
+5
⚑ Institutional Nasdaq (NQ/US100) Trend Engine: Adaptive M1–D1 EMA alignment, chop slope filters, zero-clutter symbols &
Indicator
Fibonacci
Key Levels
+5
Institutional Multi-Asset Auto-Fib engine for cTrader. Dynamic ICT 70.5% OTE zones, live R:R telemetry & HUD playbook.
cBot
SL Manager
Break Even
+5
CoreQuant Support Desk v2.0 β€” Institutional Multi-Asset Execution & Prop Risk Terminal Stop calculating lot sizes in
Indicator
VWAP
Volume
+5
Universal Multi-Asset Session VWAP: 1σ–3Οƒ statistical deviation bands, dynamic confluence scoring & live execution HUD.
cBot
VWAP
Fibonacci
+5
Autonomous Nasdaq execution engine featuring VWAP confluence, macro sweeps, and strict prop-firm drawdown defense.
8%
ROI
11.67
Profit factor
Indicator
Imbalance
Order Block
+5
Automated Nasdaq SMC for cTrader. Real-time FVG & Order Block mapping, interactive playbook HUD & zero-lag engine.

You may also like

Indicator
RSI
Forex
+4
New version of one of my favorites includes Fibonacci and moving average convergence divergence lines
Indicator
SMC
Breakout
+1
Delta Peak Bubbles is a tick‑chart overlay for cTrader that highlights the strongest momentum spikes.
Indicator
Forex
BTCUSD
+11
Visualize trends with Standard Deviation Channel! Display median, and add customizable upper/lower deviation channels.
Indicator
MSS
Volume
+3
Rejection-based volume profile with tiered heat zones, POC levels and a fully draggable anchor on cTrader.
Indicator
This indicator is a valuable tool for traders looking to identify significant opening price level of any asset.
Indicator
Prop
Forex
+4
Personal trade tracker for a single symbol. Clear net profit summary β€” FreshNet, ManageNet, DayNet, WTDNet, MTDNet.
Indicator
Prop
Forex
+4
HMA MTF 2.0 (Multi-Timeframe )
Indicator
SMC
Prop
+13
Tracks virgin levels. Lines vanish only after a candle closes beyond the high/low on your chosen timeframe.
Indicator
Doji
Volume
+5
Instantly spot high-liquidity institutional moves with clean, non-obtrusive triangle alerts on cTrader charts.
Indicator
RSI
MACD
+2
Identify potential reversal points in the market by detecting candles with exceptionally long upper or lower wicks
Indicator
Supply & Demand
Support & Resistance
Trade With Smile Indicator is a professional trading indicator designed to help traders identify potential market trends
Indicator
RSI
Forex
+12
Indicator pattern signal moment
Indicator
Forex
BTCUSD
+5
Trend analysis, automatic analysis, position, swingtrader, scalper
Indicator
RSI
RSI on the main chart with 45/55 momentum levels, overbought/oversold levels, averaged RSI, and multi-timeframe support.
Indicator
Volume
Custom range volume profile between two draggable anchors. Auto source timeframe, Total/Up-Down/Delta, POC, Value Area.
Indicator
Breakout
Institutional Flow Radar scans the chart for abnormal volume events and classifies them into two groups: Capital &Public
Indicator
Bollinger
Bollinger Bands Width
Indicator
Doji
Flag
+5
Angora Pattern Recognition is a cTrader indicator that finds, draws and tracks classic chart patterns automatically.

Price

2
Sales