

Tradingfcs_vwap
Indicator
Version 1.0, Oct 2026
Windows, Mac
4.0
Reviews: 1

Since 05/07/2026
38.89M
Traded volume
309.79K
Pips won
Description
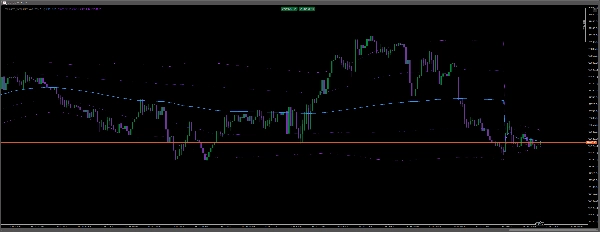
- 🔵 Blue VWAP Line: Represents the volume-weighted average trading price, helping identify intraday market direction and dynamic support or resistance.
- 🟣 Purple Deviation Bands: Highlight areas where price has moved away from its average, helping traders identify potential overextension and reversal opportunities.
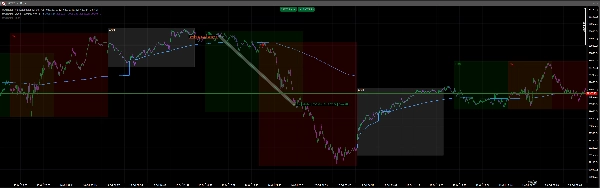
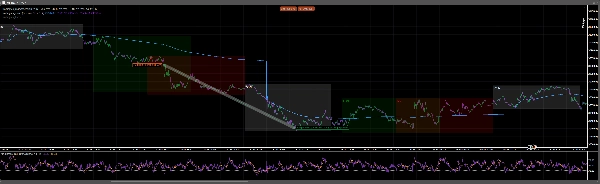
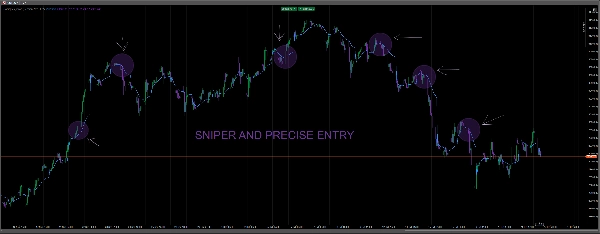
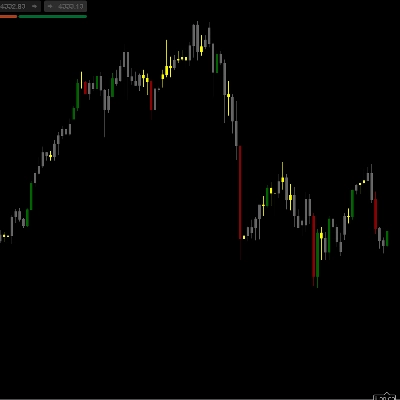
- 📈 Price Rejections: Highlighted H1 chart illustrates how price reactions around VWAP can precede bullish or bearish moves.
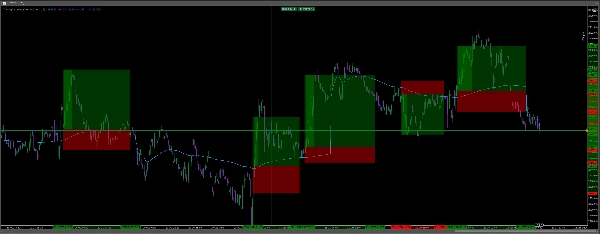
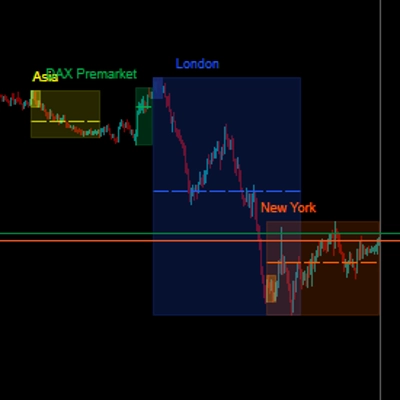
⏰ Trading Sessions: Your separate session overlays identify Asian, London, and New York trading periods, helping you evaluate opportunities during different market conditions.
----------------------------------
How It Helps Traders Spot Opportunities
🟢 BUY Opportunities: When price holds above VWAP and successfully retests it as support, traders can look for bullish continuation.
🔴 SELL Opportunities: When price trades below VWAP and rejects it as resistance, traders can identify potential bearish continuation.
⚡ Precision Scalping: On the M1 and M5 timeframes, VWAP helps traders identify potential entries, pullbacks, and exits using price action and momentum confirmation
Summary
AI summary
Tradingfcs_vwap is a technical indicator designed to assist traders in identifying intraday market trends and potential trade entries using the Volume Weighted Average Price (VWAP). It features a blue VWAP line that reflects the average trading price weighted by volume, serving as a dynamic support or resistance level. Purple deviation bands highlight price movements away from the VWAP, indicating possible overextensions and reversal points.
The indicator also visualizes price rejections on the hourly chart, showing how price interactions with the VWAP can signal bullish or bearish moves. Separate overlays mark the Asian, London, and New York trading sessions, enabling traders to assess market behavior across different periods.
Key trading signals include:
- Buy opportunities when price holds above VWAP and retests it as support.
- Sell opportunities when price trades below VWAP and rejects it as resistance.
- Precision scalping on 1- and 5-minute timeframes by identifying entries, pullbacks, and exits through price action and momentum confirmation.
This tool supports analysis based on volume, support and resistance, and trend strength, using bar data inputs and providing signal outputs for enhanced decision-making in various trading styles.
The indicator also visualizes price rejections on the hourly chart, showing how price interactions with the VWAP can signal bullish or bearish moves. Separate overlays mark the Asian, London, and New York trading sessions, enabling traders to assess market behavior across different periods.
Key trading signals include:
- Buy opportunities when price holds above VWAP and retests it as support.
- Sell opportunities when price trades below VWAP and rejects it as resistance.
- Precision scalping on 1- and 5-minute timeframes by identifying entries, pullbacks, and exits through price action and momentum confirmation.
This tool supports analysis based on volume, support and resistance, and trend strength, using bar data inputs and providing signal outputs for enhanced decision-making in various trading styles.
Indicator profile
Indicator category
Support & resistance
Output type
Signals
Data requirements
Bars only
Supported signals
Trend strength
Discussion
Customer reviews
4.0
Reviews: 1
5 | 0 % | |
4 | 100 % | |
3 | 0 % | |
2 | 0 % | |
1 | 0 % |
Customer reviews
October 22, 2026
VWAP and deviation bands give the H1 rejection examples a clear reference. Session overlays add timing, and the description distinguishes holding above the average from rejecting below it. A useful context view rather than one mechanical rule for every band touch.
FAQ
VWAP
Support & Resistance
Products available through cTrader Store, including trading bots, indicators and plugins, are provided by third-party developers and made available for informational and technical access purposes only. cTrader Store is not a broker and does not provide investment advice, personal recommendations or any guarantee of future performance.




Price
Since 05/07/2026
38.89M
Traded volume
309.79K
Pips won