Description
Clustering Indicator
Overview
The Clustering Indicator is a powerful tool designed to help traders identify patterns, trends, and anomalies in market data. By grouping similar data points into clusters, this indicator provides valuable insights that can be used to make informed trading decisions.
Features
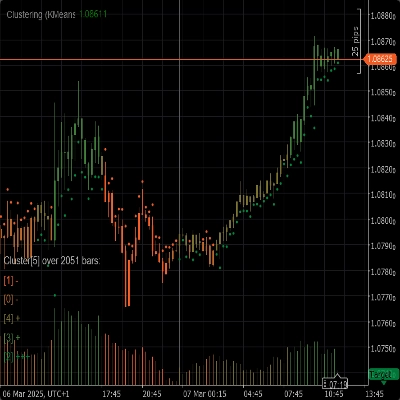
- Clustering Algorithms: Utilizes advanced clustering algorithms like K-Means and Gaussian Mixture Model (GMM) to segment the market data effectively.
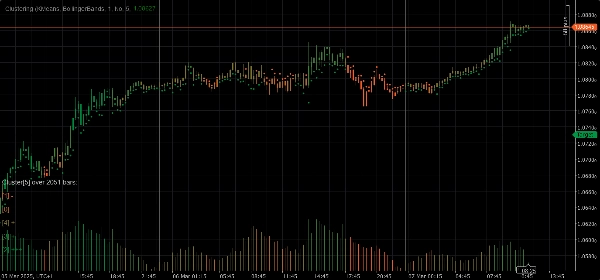
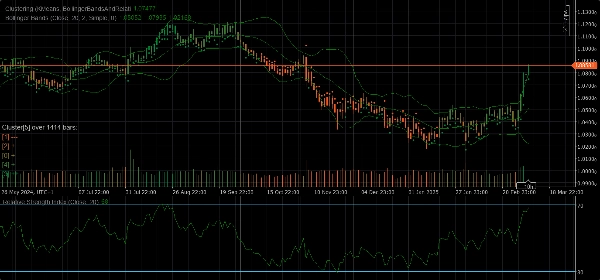
- Feature Sets: Offers a variety of feature sets including Raw Price, Bollinger Bands, Relative Strength Index (RSI), Stochastic Oscillator, Bollinger Bands and RSI, and combinations of these indicators to capture different aspects of market behavior.
- Dynamic Clustering: Automatically determines the optimal number of clusters ensuring that the clustering is as accurate as possible.
- Visualization: Provides clear visual insights into cluster movements and volatility directly on your chart.
Parameters
- Clustering Algorithm: Choose between K-Means or Gaussian Mixture Model (GMM) to best fit your trading strategy.
- Feature Set: Select from Raw Price, Bollinger Bands, RSI, Stochastic Oscillator, Bollinger Bands and RSI, or a full market data set including various indicators.
- Window: Define the number of bars to consider for each data point.
- Auto K: Automatically determine the number of clusters based on your data.
- Initial K: Set an initial number of clusters if Auto K is disabled.
- Max Historical Bars: Limit the maximum number of historical bars used for clustering. If set to 0, all available bars are used.
- Color By Clusters: Enable or disable chart re-coloring based on the actual cluster assignments.
- Show Insights: Display detailed insights about each cluster directly on the chart.
- Show Indicators: Show the indicators used in the feature sets.
Auto Adaptation Parameters
- Auto Adapting: Enable or disable auto-adaptation mode, which allows the indicator to reinitialize clusters based on specified conditions.
- Auto Adaptation Hour: The hour of the day when auto-adaptation can occur (0-23).
- Auto Adaptation Period: The minimum number of hours that must pass since the last adaptation before another adaptation can occur.
Feature Set Parameters
Bollinger Bands Parameters
- Period: The period for calculating the Bollinger Bands.
- Deviation: The standard deviation multiplier for the Bollinger Bands.
- Moving Average Type: The type of moving average used in the Bollinger Bands calculation (Simple, Exponential, etc.).
Relative Strength Index (RSI) Parameters
- Period: The period for calculating the RSI.
Stochastic Oscillator Parameters
- Period: The K period for the Stochastic Oscillator.
- K Slowing: The K slowing factor for the Stochastic Oscillator.
- D Period: The D period for the Stochastic Oscillator.
- Moving Average Type: The type of moving average used in the Stochastic Oscillator calculation (Simple, Exponential, etc.).
- Calculation Type: The calculation type for the Stochastic Oscillator (LowHigh, CloseClose, etc.).
Usage
1. Add the Clustering Indicator to your chart.
2. Configure the parameters according to your trading strategy.
3. Analyze the clusters and their movements on the chart.
4. Use the insights provided by the indicator to make informed trading decisions.
Summary
Customer reviews
5 | 50 % | |
4 | 50 % | |
3 | 0 % | |
2 | 0 % | |
1 | 0 % |


!["Gaussian Channel [Iridio Capital]" logo](https://cdn.ctrader.com/image/webp/7c039209-5573-4a54-a072-f9528b503103_41960)