
Description
Hyper Trend PRO does not just tell you the trend has turned. It tells you how much the rest of the chart agrees.
How a signal is made
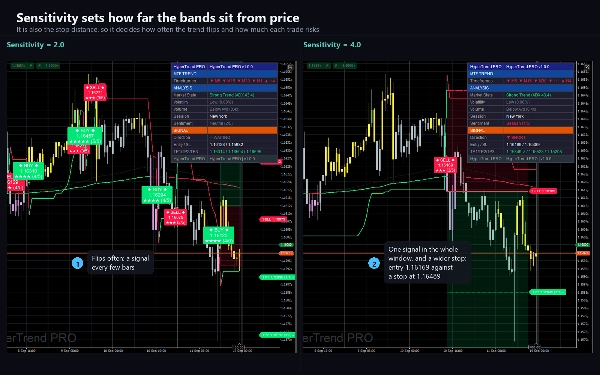
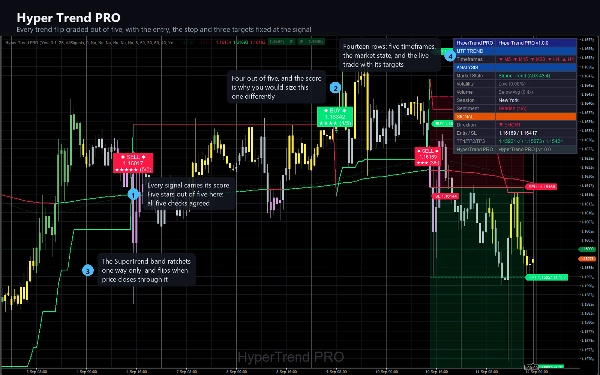
A SuperTrend built on the average true range marks the trend. Bands are placed above and below price at a multiple of a 25 bar ATR, each band ratchets one way only, and the trend flips when price closes through the band on the far side. Every signal begins as one of those flips and nothing else creates one.
The flip is then graded out of five. Five independent factors vote:
- the MACD histogram, rising or falling against the previous bar
- the 150 period EMA against the 250 period EMA
- ADX above 20, so a flip inside a dead range is marked as one
- volume against its own 20 bar average
- the slope of a 55 period Hull moving average
The score is drawn on the signal as stars and as a number out of five, and named on the alert as Weak, Moderate or Strong. It is the difference between a flip that four other measures agree with and one that stands alone.
Choosing how selective it is
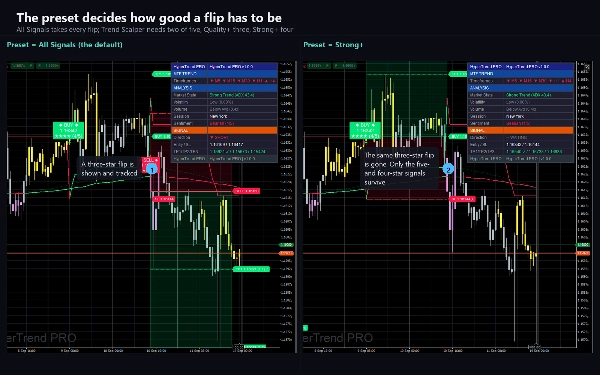
A preset sets the minimum score a flip must earn: All Signals takes everything, Trend Scalper needs two, Quality+ needs three and Strong+ needs four. Six further filters can each veto a signal on its own: trending markets only, strong scores only, above average volume only, aligned with the cloud only, and a contrarian mode that only takes a flip when a smoothed RSI is already stretched the other way. Every one of them is off until you turn it on.
The trade it draws
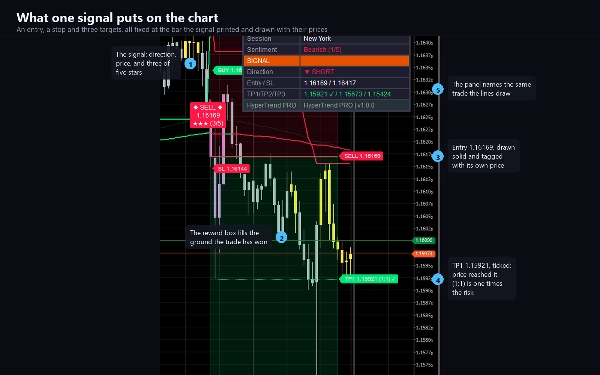
The moment a signal prints, the indicator fixes an entry, a stop and three targets and draws each one as a labelled line carrying its price.
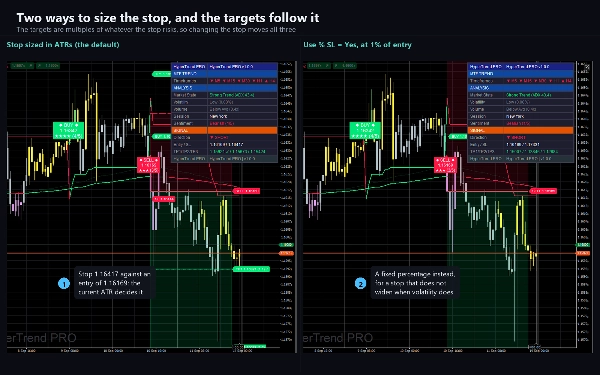
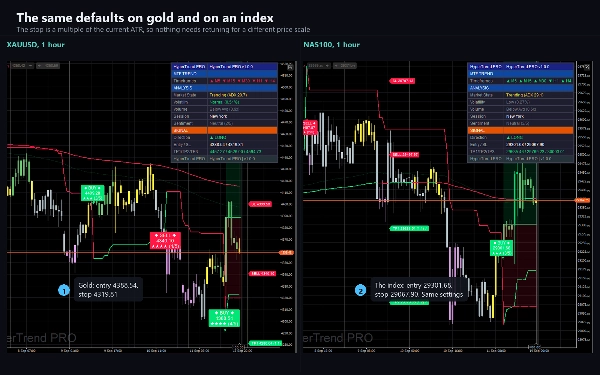
- The stop is a multiple of the current ATR, so the same settings behave sensibly on a five minute chart and on a daily one, and on a currency pair and on gold. A fixed percentage stop is available instead.
- The three targets are multiples of that same risk, so the defaults of 1.0, 2.0 and 3.0 are literally one, two and three times what you are risking.
- Each target is ticked as price reaches it. Reaching the third target, or the stop, closes the tracked trade.
- An optional ATR trailing stop is drawn behind an open trade.
What else is on the chart
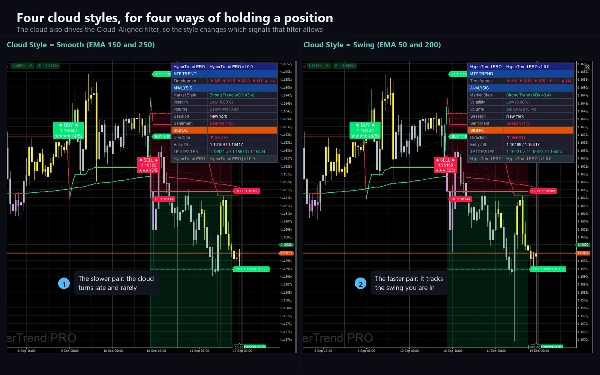
- A cloud between two moving averages, in four styles: a smooth EMA pair, two scalping variants and a swing pair.
- A 250 period Trend Tracer line that changes colour with price.
- Candles tinted through six steps according to how strong the MACD histogram is relative to volatility, so a weakening move is visible before it turns. The Candle Coloring setting switches them to the trend colours, shades them by the confluence score, or leaves them alone when another indicator colours candles on the same chart.
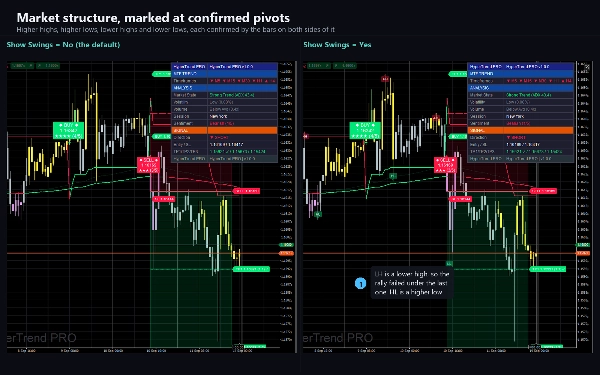
- Optional market structure labels marking higher highs, lower highs, higher lows and lower lows.
- Optional pullback markers from a WaveTrend oscillator, for re entry inside a trend rather than at its start.
The dashboard
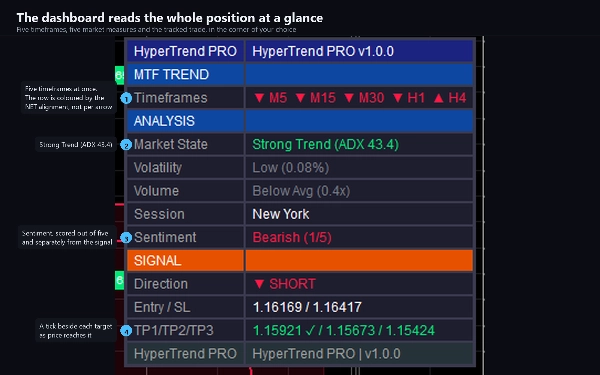
Fourteen rows in the corner of your choice. The top block reads five timeframes at once, M5 to H4, and shows which way each of them is leaning. Below it: the market state with its ADX, volatility as a percentage of price, volume against its average, the trading session, and a second five point score for overall sentiment. The bottom block is the last signal, its entry and stop, and its three targets with a tick beside each one that has been reached.
Alerts
Nine events, each behind its own switch: buy, sell, any signal, strong signal, the stop, the three targets and a trend change. Each fires once per closed bar and never for history, so attaching it to a long chart does not produce a wall of old alerts. Delivery is the cTrader log, an optional sound and optional e-mail through your own cTrader settings.
Settings
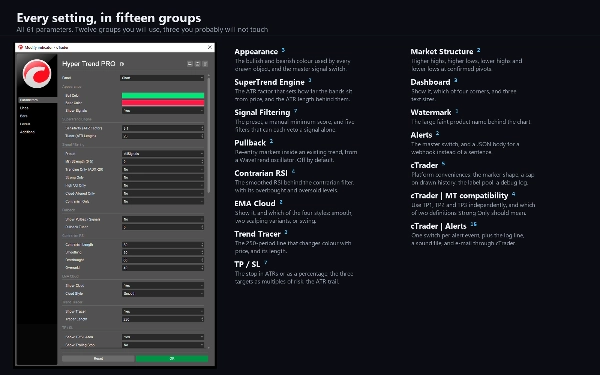
62 parameters in twelve groups you will use and three you probably will not touch. Appearance, the SuperTrend engine, signal filtering, pullback, contrarian RSI, the cloud, the tracer, risk, market structure, the dashboard, the watermark and alerts. The rest are cTrader conveniences: the candle colouring mode, a marker style, an object cap, a debug log, three compatibility switches and one switch per alert event.
Type, timeframes and instruments
An overlay indicator for trend and momentum analysis. Its longest average is 250 bars, so it wants a chart with some history behind it; M15, H1 and H4 are the window it was designed around, and it runs on any timeframe. It has been checked on major currency pairs, on gold and on indices. It uses bars and volume: no tick data, no depth of market, no external data.
Who it is for
Traders who want a trend signal that comes with a grade rather than a yes or no, and who want the stop and the targets decided at the same moment as the entry rather than afterwards.
The trial
The trial edition is this same build with one restriction: it runs on EURUSD only, and broker suffixes such as EURUSD.i are accepted. There is no time limit and every parameter is available. The full version adds every other symbol.
Technical notes
Signals do not repaint. They are evaluated on closed bars only, so a marker never appears during a candle and then disappears when it closes. The cost of that is a one bar delay, and it is deliberate. While a trade is open its level lines and their labels extend to the right with the chart, which moves the drawing and not the levels.
The indicator declares no access rights. It opens no network connection, reads no file, and never places, modifies or closes an order. The ticks on the dashboard record that price touched a drawn level on the loaded history, with no spread, commission or slippage in them.
Support
Questions go through the Discussion tab of this listing. Please include your symbol, timeframe, broker, cTrader version and a screenshot with the dashboard visible.
Trading involves risk. Past performance does not guarantee future results.
Summary
The indicator fixes entry points, ATR-based stops, and three risk-multiplied targets at the moment a signal occurs, with optional trailing stops. Multiple filters allow users to customize signal selectivity, including trend strength, volume, cloud alignment, and contrarian RSI conditions.
Additional chart features include a configurable cloud between moving averages, a 250-period Trend Tracer line, candle tinting based on MACD strength, market structure labels, and pullback markers from a WaveTrend oscillator. A dashboard displays multi-timeframe trend direction, market state, volatility, volume, session info, sentiment scores, and trade progress.
Hyper Trend PRO supports major currency pairs, gold, and indices, using bar and volume data without tick or external inputs. Alerts cover nine event types with controlled delivery. The indicator does not repaint and operates with a one-bar delay for signal confirmation. It requires no special access rights or order execution capabilities.