Description
MTC INTERACTIV RAINBOW PRO
WHY THIS RAINBOW IS DIFFERENT
Rainbow indicators have been around for years, beautiful bands of moving averages on the chart. The problem: almost nobody really knows how to read them or turn them into decisions. They look great… and then sit there, unused.
MTC Interactiv Rainbow Pro fixes exactly that, interactively. Instead of staring at dozens of colored lines and guessing, you work WITH the rainbow: hover, click, focus, measure, and let the chart explain itself.
WHAT YOU SEE
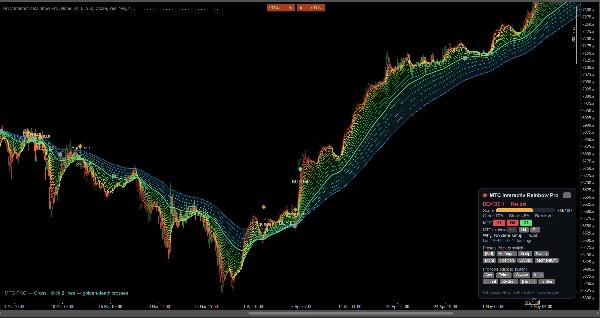
• A dense, smooth EMA rainbow that shows trend direction, strength and momentum at a single glance.
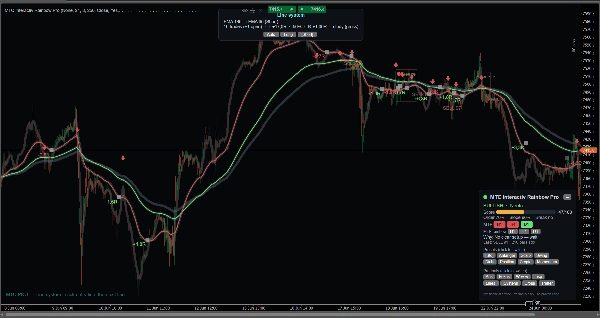
• Clear BUY / SELL / EXIT markers and squeeze/breakout zones — all on closed bars, no repaint.
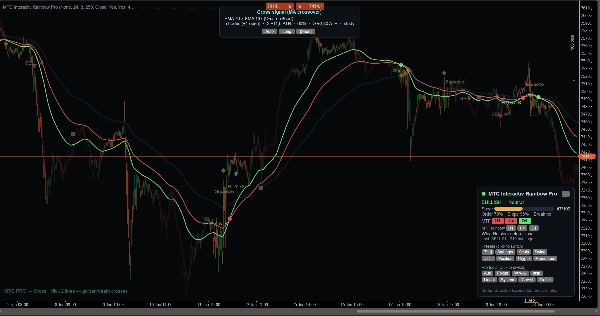
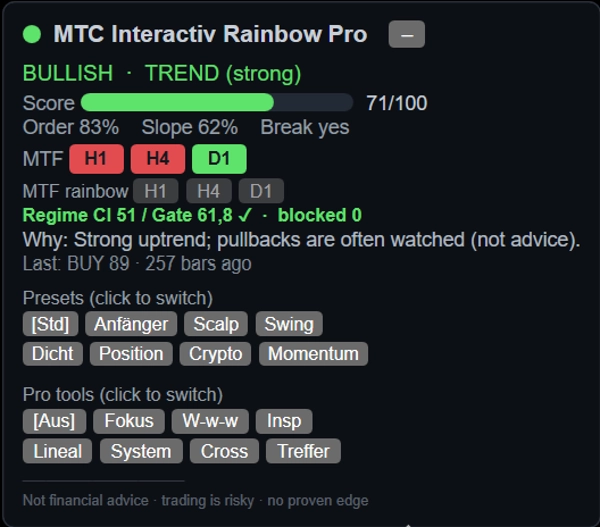
• A compact live dashboard: direction, a 0–100 strength score, order/slope/breakout read-outs, multi-timeframe consensus, and a plain-language "why".
WHAT MAKES IT INTERACTIVE (the part nobody else gives you)
• Hover any line to instantly see its EMA period — finally know which average you are looking at.
• Focus a single line and dim the rest for a clean view.
• "What-if" and Inspect tools to study any bar or past signal.
• A built-in Ruler (ATR / R / pips).
• Line-System & Cross studies to explore how two averages interact.
• Respect-rate study: how often price actually respects a chosen line.
• One-click MTF Rainbow overlay: see the H1 / H4 / D1 rainbow on your current chart in grey.
• 8 one-click presets (Beginner, Scalp, Swing, Position, Crypto, Momentum, Dense, Standard).
• Optional regime filter and a trade-management overlay (structure stop, 1R risk band, trailing line) for disciplined risk thinking.
HOW TO READ IT
Fanned out and ordered = strong trend. Squeezing together = coiling, a breakout is near. Arrow up/down = breakout signal. The denser and more ordered the band, the stronger the move. A built-in interactive tutorial (English & German) walks you through it step by step.
WHO IT'S FOR
• Beginners who always wanted to use a rainbow but never knew how — the interactive tools teach you as you go.
• Experienced traders who want a fast, clean read of trend, momentum and multi-timeframe context.
• Bot builders: a transparent research base for your own EMA / MA strategies and bots.
Works on any symbol and timeframe; the interactive tools shine on M5–H4. No minimum account size — it is an analysis tool, not an autotrader.
IMPORTANT — PLEASE READ
This is an analysis and learning tool, NOT investment advice and not a profit guarantee. All signals, scores and simulated trades are observations, not a statistically proven edge. Leveraged trading is risky and can lead to total loss. Always make your own decisions and test on a demo account first.
Summary
Key features include an interactive interface allowing users to hover over lines to identify EMA periods, focus on individual lines, and use tools like "What-if" analysis, inspection of past signals, and a built-in ruler measuring ATR, price range, and pips. The indicator offers line-system and cross studies to analyze interactions between averages, a respect-rate study to assess price adherence to specific lines, and a one-click multi-timeframe rainbow overlay showing higher timeframe EMAs in grey.
A compact live dashboard provides a 0–100 strength score, order, slope, breakout readings, multi-timeframe consensus, and plain-language explanations. Eight one-click presets cater to various trading styles and markets, including scalp, swing, position, crypto, and momentum trading. Additional features include an optional regime filter and trade-management overlays for risk control.
Suitable for all symbols and timeframes, especially effective on M5 to H4 charts, this tool supports traders ranging from beginners learning to use EMA rainbows to experienced traders and bot developers seeking a transparent EMA research base.