

present
Sign up and get $50 off your first purchase
Trading product for Hurst Cycle Panel Indicator Key Levels Market Structure, image 1
Hurst Cycle Panel
Indicator
Version 1.0, Jun 2026
Windows, Mac
Trading product for Hurst Cycle Panel Indicator Key Levels Market Structure, image 2
Trading product for Hurst Cycle Panel Indicator Key Levels Market Structure, image 3
Trading product for Hurst Cycle Panel Indicator Key Levels Market Structure, image 4
Since 21/07/2025
1
Sales

Description

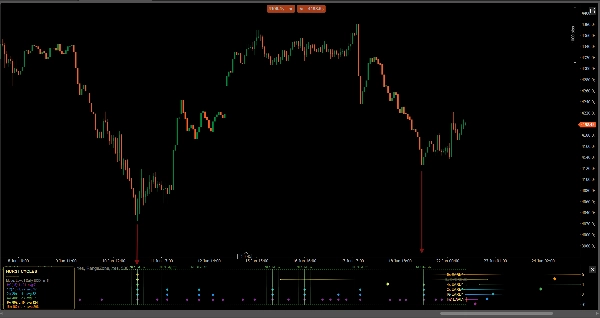
MTC Hurst Cycle Akademica maps the cyclic structure of any market, tier by tier, in a dedicated sub-pane. Built on the cyclic market model of J. M. Hurst, it marks the confirmed cycle troughs (and optionally crests) of each enabled cycle tier as colour-coded diamonds, projects the timing of the next expected cycle low, and highlights "Nest of Lows" — bars where several cycle lows are expected to coincide, Hurst's classic high-probability turning context.

KEY FEATURES

• 7 nested cycle tiers (HC, 1C, 2x, 4x, 8x, 16x, 32x) — enable any combination.

• Confirmed-only diamonds — the most recent markers do NOT repaint on the live bar.

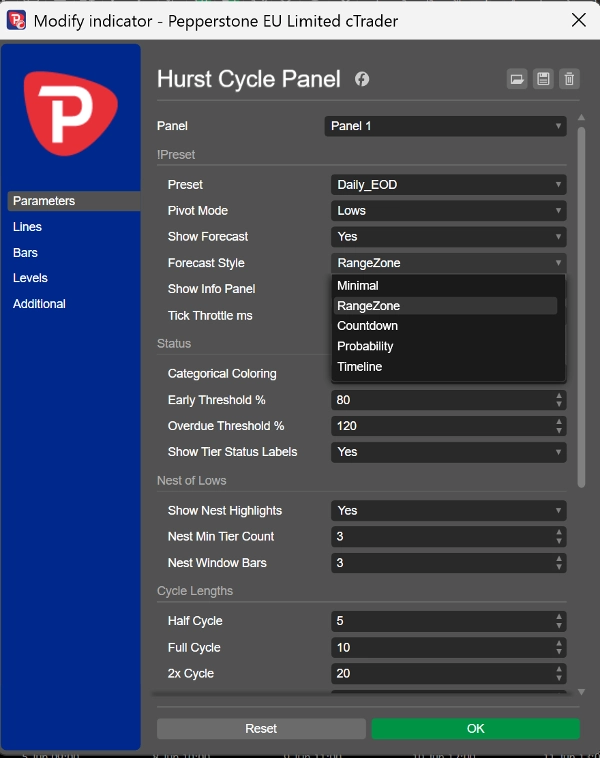
• Next-trough forecast in 5 display styles: Minimal, Range Zone, Countdown, Probability (1σ / 2σ), Timeline.

• "Nest of Lows" highlighting, scaled automatically to the enabled cycle lengths.

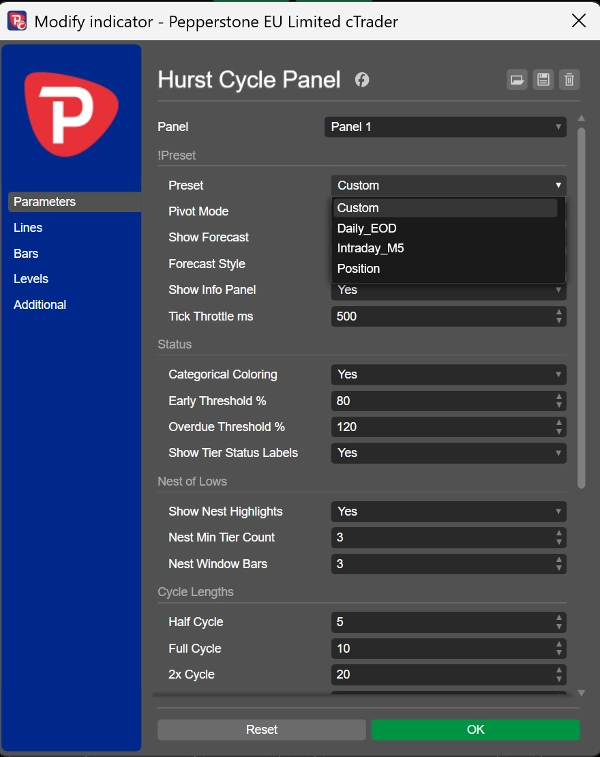
• One-click presets: Daily EOD, Intraday M5, Position — or fully custom cycle lengths.

• Modern on-chart info panel: per-tier pivot counts, measured average cycle length (shown only when statistically meaningful), and a harmonic-ratio check.

• Pivot mode: Lows, Highs or Both.

• Auto-fitting scale, clean and flicker-free rendering.

HOW TO USE

Add it below your price chart. Read the lowest diamonds and the "Nest" highlight as the cycle-timing backbone of the market, and use the forecast to anticipate the timing window of the next turn. It pairs naturally with MTC Hurst FLD Akademica (price levels) and MTC Hurst Pulse Akademica (cycle-maturity oscillator).

WORKS ON

Any symbol and any timeframe.

DISCLAIMER

This is a technical-analysis and visualization tool based on the cyclic market theory of J. M. Hurst. It does not place orders and makes no performance, accuracy or profit guarantees. Cycle analysis is probabilistic and forward projections are estimates, not predictions. Always apply your own risk management and judgement. Past market behaviour does not guarantee future results.

Summary

AI summary
The Hurst Cycle Panel is a technical analysis indicator that visualizes the cyclic structure of any market across multiple nested cycle tiers within a dedicated sub-pane below the price chart. Based on J. M. Hurst's cyclic market theory, it identifies and marks confirmed cycle troughs and optionally crests as color-coded diamonds, which do not repaint on the live bar. The indicator forecasts the timing of the next expected cycle low using five display styles: Minimal, Range Zone, Countdown, Probability (1σ / 2σ), and Timeline. It also highlights "Nest of Lows," bars where multiple cycle lows coincide, indicating high-probability turning points.

Key features include seven nested cycle tiers (HC, 1C, 2x, 4x, 8x, 16x, 32x) with customizable combinations, one-click presets for common timeframes (Daily EOD, Intraday M5, Position), and a modern on-chart info panel showing pivot counts, average cycle length, and harmonic-ratio checks. Users can select pivot modes (Lows, Highs, or Both) and benefit from auto-fitting scale and flicker-free rendering.

The panel works on any symbol and timeframe and is intended as a visualization tool to aid cycle timing analysis. It complements other Hurst-based tools for price levels and cycle maturity oscillation.

Indicator profile
Indicator category
Momentum
Output type
Visualisation
Filter
Signals
Data requirements
Bars only
Tick data
Supported signals
Reversal

Customer reviews

0.0
Reviews: 0
Customer reviews
No reviews for this product yet. Already tried it? Be the first to tell others!

Discussion

FAQ

Key Levels
Market Structure
Products available through cTrader Store, including trading bots, indicators and plugins, are provided by third-party developers and made available for informational and technical access purposes only. cTrader Store is not a broker and does not provide investment advice, personal recommendations or any guarantee of future performance.

More from this author

Indicator
ATR
EMA
+2
Dense EMA rainbow + Pro tools & a tested engine — get more from your EMAs, your research base for EMA bots.
Indicator
Fibonacci
Key Levels
+1
Draw & learn Elliott, Harmonic, NeoWave manual plotting with built-in rule validator & coach.
Indicator
Fibonacci
Key Levels
+4
Harmonic market structure across every scale, via Leibniz's Monadology — by David Murawski, der Mustermann.

You may also like

Indicator
Master RSI reversals with Parabolic SAR precision! Get real-time alerts for high-probability trend changes.
Indicator
Prop
Forex
+11
Ultimate Session Tool: Boxes, OR, KZs, PD Levels, Overlaps, Custom Lines & Names, Info Panel! Highly customizable 📉📈
Indicator
Shows daily and sessions highs / lows and session boxes, everything configurable
Indicator
ATR
Channel
Reversal Trap Probability Bands plots a dynamic volatility envelope around price & automatically detects "trap" reversal
Indicator
Volume
Channel
+5
Spots volatility squeezes before they fire — the compression phase everyone else misses.
Indicator
Prop
Forex
+12
Identify and trade breakouts with Consolidation Zones! Visualize price consolidation areas for trading opportunities.
Indicator
ATR
MSS
+5
Grades ICT Unicorn setups (Breaker Block + FVG confluence) into PRIME / SETUP / WATCH, with retest & RR targets.
Indicator
Engulfing
Fibonacci
+4
Six higher-timeframe candle sets on one chart, with liquidity sweep detection and swept levels.
Indicator
SMC
Forex
+5
The only cTrader FVG indicator with Breakaway Gap detection, mitigation tracking, and full multi-asset compatibility.
Indicator
RSI
SMC
+3
High Low Divergence is a clean, overlay indicator that automatically identifies swing highs and swing lows
Indicator
Prop
Forex
+9
Trend Sniper — session-based tool highlighting live session ranges and adaptive Custom line.
Indicator
ATR
RSI
+14
A metric that can set 1 to 3 groups of Bollinger Bands
Indicator
ATR
Upgrade to ATR-RMA! Experience the precise ATR using Relative Moving Average for accurate volatility analysis in cTrader
Indicator
BOS
CHOCH
+5
A professional-grade cTrader indicator for traders following the Inner Circle Trader (ICT) methodology.
Indicator
This indicator is a valuable tool for traders looking to identify significant opening price level of any asset.
Indicator
The Weekly Daily Levels indicator shows the OHLC, and mid-point prices for the previous day and week.
Indicator
Advanced customizable volume-profile indicator with buy/sell levels, delta analysis, multi-TF support and vivid gradient
Indicator
Forex
EURUSD
+5
Fimathe Indicator - Fimathe PCM - Automated Trend Channels & Levels — Ideal for live trading and backteting

Price

Since 21/07/2025
1
Sales


















