
VegaXLR - Analysis Tools Alerts
Indicator
2 purchases
Version 1.1, Apr 2026
Windows, Mac
4.5
Reviews: 2
Description
cTrader Analysis Tools Alerts is an all-in-one indicator designed to enhance your charting experience by adding alerts, labels, and automatic color-coding to various drawing tools.
Features:
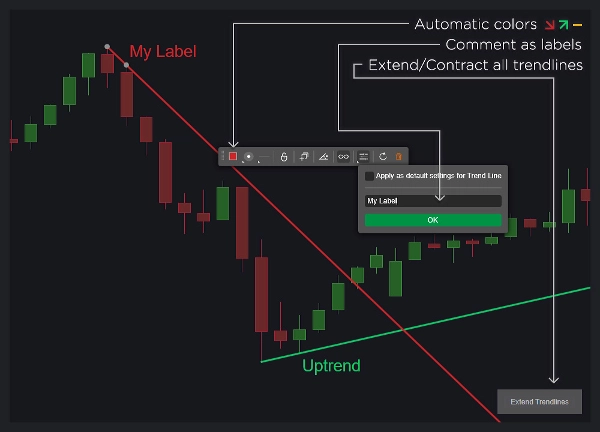
- Trendlines:
- Display custom labels using object comments.
- Dynamic color changes based on trendline direction.
- Option to remove trendlines after an alert.
- Enable or disable trendline-specific alerts.
- Extend or contract all trendlines with a single click.
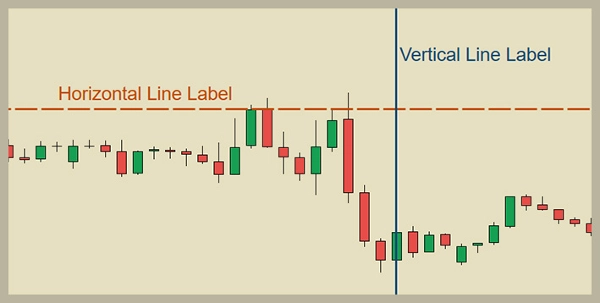
- Horizontal and Vertical Lines:
- Display custom labels using object comments.
- Automatically delete lines after an alert.
- Configure alerts for each line type.
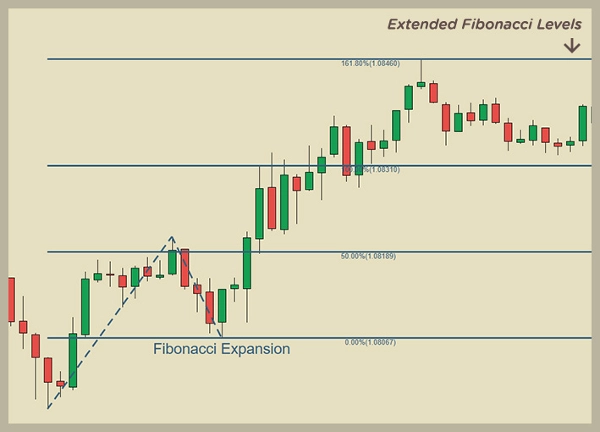
- Fibonacci Retracement and Expansion Levels:
- Display custom labels using object comments.
- Automatically extend level lines to infinity.
- Option to delete objects after an alert.
- Assign colors based on drawing direction.
- Enable or disable alerts for Fibonacci levels.
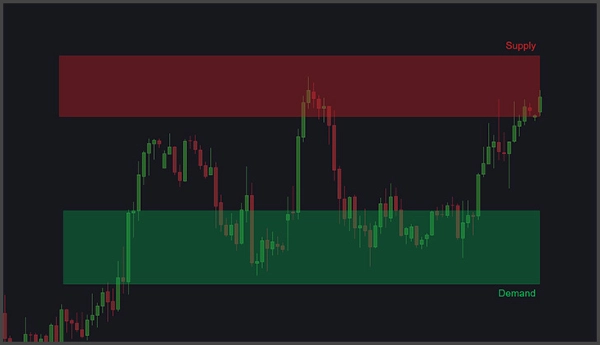
- Rectangles (Supply and Demand Areas):
- Display custom labels using object comments.
- Alerts for price interactions and tick volume spikes.
- Set parameters for tick volume spike alerts, including look-back bars, percentage volume increase, and pause period post-alert.
- Automatic rectangle fill and extension to the active candle.
- Overall Customization:
- Adjust label positions and text sizes for each object type.
- Customize automatic colors.
- Include object comments in alert messages.
- Enable or disable alerts for each object type.
- Alerts and Help:
- Receive alerts via sound, pop-ups, Telegram, and email.
- Automatic chart screenshots sent to Telegram.
- User Guide accessible through a small button on the chart.
This tool is ideal for traders utilizing support and resistance, supply and demand, Fibonacci, or trendlines in their strategies.
Summary
AI summary
VegaXLR - Analysis Tools Alerts is an all-in-one indicator for the cTrader platform that enhances chart analysis by integrating alerts, labels, and automatic color-coding with various drawing tools. It supports trendlines, horizontal and vertical lines, Fibonacci retracement and expansion levels, and rectangles representing supply and demand areas.
Key features include:
- Trendlines: Custom labels from object comments, dynamic color changes based on direction, options to remove or extend trendlines after alerts, and toggle alerts per trendline.
- Horizontal and Vertical Lines: Custom labels, automatic deletion after alerts, and configurable alerts per line type.
- Fibonacci Levels: Custom labels, infinite extension of level lines, color assignment by drawing direction, and alert enable/disable options.
- Rectangles (Supply and Demand): Custom labels, alerts for price interactions and tick volume spikes with adjustable parameters, automatic fill and extension to the active candle.
- Overall customization allows adjustment of label positions, text sizes, automatic colors, inclusion of comments in alerts, and enabling/disabling alerts per object type.
- Alerts can be received via sound, pop-ups, Telegram, and email, with automatic chart screenshots sent to Telegram.
- A user guide is accessible directly on the chart.
This tool is suited for traders employing support and resistance, supply and demand, Fibonacci, or trendline strategies.
Indicator profile
Indicator category
Support & resistance
Output type
Visualisation
Data requirements
Bars only
Supported signals
Cross
Breakout
Level touch
Level break
Reversal
Trend strength
Customer reviews
4.5
Reviews: 2
5 | 50 % | |
4 | 50 % | |
3 | 0 % | |
2 | 0 % | |
1 | 0 % |
Discussion
FAQ
Fibonacci
Forex
Supply & Demand
Support & Resistance
Products available through cTrader Store, including trading bots, indicators and plugins, are provided by third-party developers and made available for informational and technical access purposes only. cTrader Store is not a broker and does not provide investment advice, personal recommendations or any guarantee of future performance.


Price
215
Sales
677
Free installs