
Description
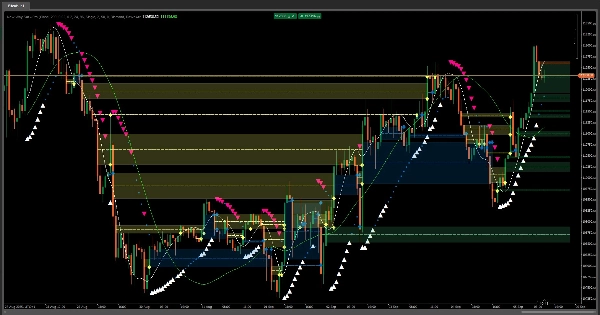
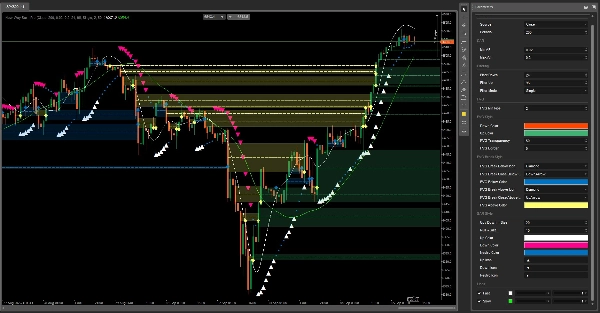
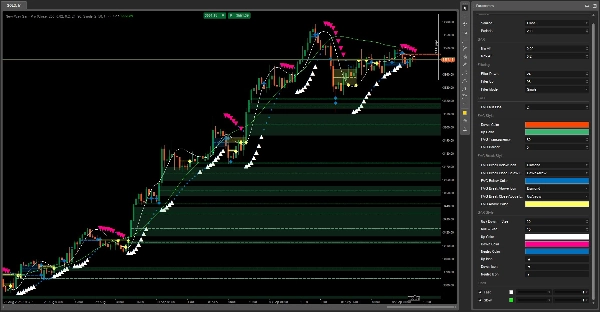
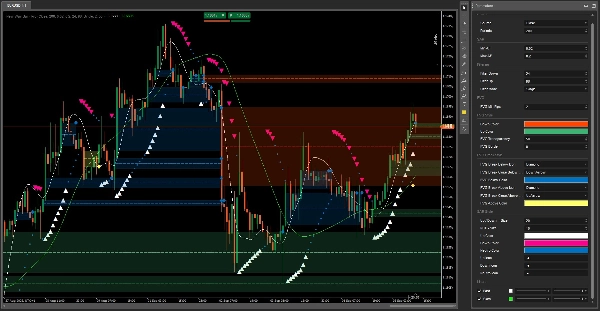
The Parabolic SAR, or "Stop and Reverse," is a dynamic technical analysis tool that helps traders identify potential trend reversals and set trailing stop-loss orders. Unlike traditional indicators, the Parabolic SAR creates a series of dots that follow the price movement, adjusting as the trend gains momentum.
Our modern version offers a fresh, intuitive approach to this classic indicator. By combining powerful, reliable signals with a clean and modern design, it helps traders easily visualize trend direction and potential entry or exit points. By integrating key market levels like Fair Value Gaps, this version provides a comprehensive system for making more precise and confident trading decisions, giving you the clarity needed to navigate the markets with confidence.
Summary
Customer reviews
5 | 50 % | |
4 | 50 % | |
3 | 0 % | |
2 | 0 % | |
1 | 0 % |


