Brokers & props
For business
00
Days
:
00
Hours
:
00
Minutes
:
00
Seconds
Indicator
Indices
Commodities
Stocks
Forex
Crypto
PRC Momentum Hybrid
5.0
19/12/2025
38
Desktop
SinceĀ 22/09/2024
Sales
119
Free installs
9492
"PRC Momentum Hybrid" uploaded image"PRC Momentum Hybrid" uploaded image"PRC Momentum Hybrid" uploaded image"PRC Momentum Hybrid" uploaded image"PRC Momentum Hybrid" uploaded image

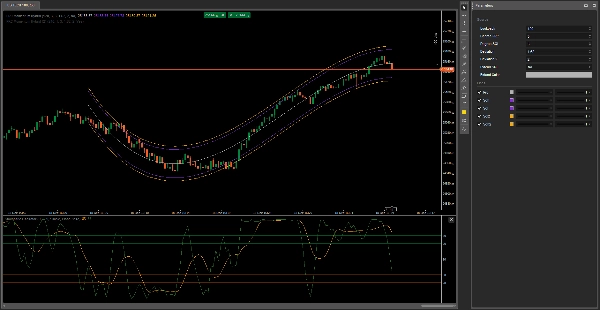
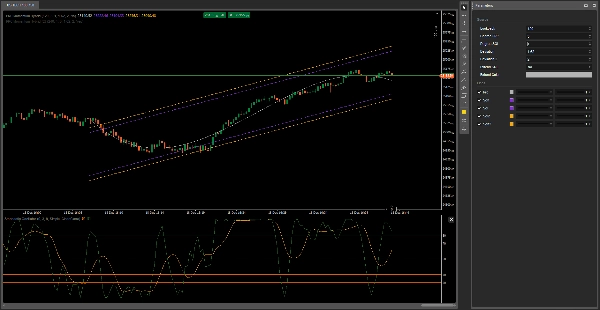
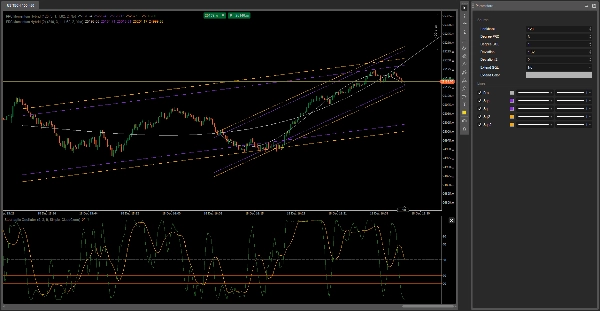
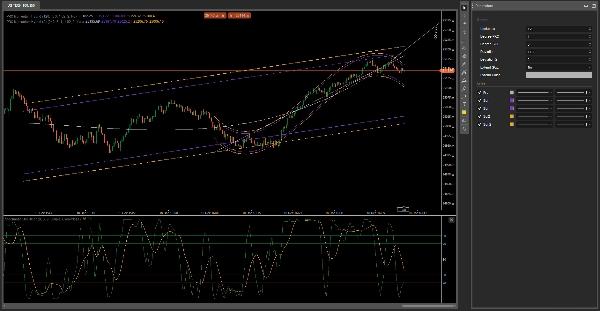
1. The "Acceleration vs. Baseline Trend" Filter

This is the number one technical advantage.

Level 1 (Straight Lines): Represents the market's inertia or average trend. It's the "highway" the price should be following.

Level 3 (Curves): Represents the market's acceleration and immediate emotional sentiment.

Trader Advantage: When the Level 3 channel curves and breaks out of the Level 1 channel, it indicates a market climax (overspeeding). It's the perfect warning that the price is overextended and will soon return to the linear base.

2. Identifying Volatility Squeezes

Advantage: High-probability nodes are formed where the orange (straight) and purple (curved) lines intersect.

How to explain it: "Look for the intersection points. When the price is rejected by both a straight line and a curve simultaneously, you have double confirmation that the price has encountered an insurmountable obstacle."

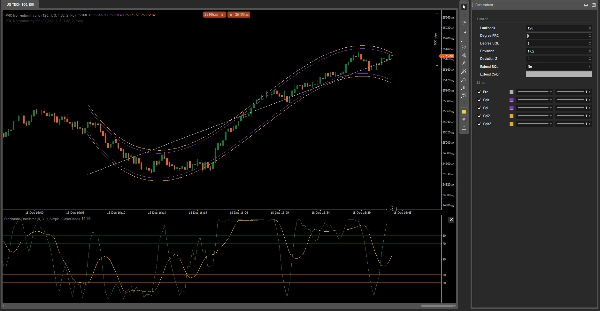
3. The "Trend Trap" (Visual Divergence)

Advantage: Helps avoid false breakouts.

Explanation: Sometimes the price breaks the linear channel (Grade 1), giving us a buy signal, but the Grade 3 channel is already curving downwards.

Value for the user: "Our dual setup protects you from traps: if the straight line tells you 'go up' but the curve is 'bending,' stay out. The curve always detects exhaustion before the straight line."

5.0
Reviews: 2
5
100 %
4
0 %
3
0 %
2
0 %
1
0 %
Customer reviews
December 22, 2025
PRC Momentum Hybrid offers a clean blend of price momentum and trend filtering. Fast, lightweight and easy to read, it helps spot acceleration and fading moves. Best used as confirmation with structure or levels. Alerts and ATR adaptation would make it even stronger.
December 20, 2025
nice indicator
More from this author
VWAP-Free
VWAP only timeframe
Indicator
NAS100
NZDUSD
XAUUSD
+10
MarketSession-MX
šŸ˜ŽRead the description before purchasingšŸ’©
Indicator
Indices
Prop
Stocks
+3
4MA
This indicator consists of 3 moving averages that can be configured to your liking, from the type of moving average....
Indicator
Stocks
Forex
MACD
MACDVolume
šŸ˜ŽRead the description before purchasingšŸ’©
cBot
Commodities
MACD
SparrowBot-FreeTrial-V2
This bot can automatically generate buy and sell orders based on three specific Fixed bugs
Indicator
Grid
NAS100
NZDUSD
+15
RangeBoxLevel
This technical analysis indicator provides information on market sentiment, trend and price levels....
Indicator
Grid
NAS100
NZDUSD
+16
AllPattern
šŸ” Discover All Candlestick Patterns… Absolutely Free!
Desktop plugin
Breakout
Signal
RiskRewardCalculator
The Risk-Reward plugin is a tool to visualize a trading idea based on other analysis tools,
Indicator
NAS100
NZDUSD
XAUUSD
+11
SessionOne
Session One is a tool for marking from to, useful if you've set the hours you want to trade
Indicator
Grid
NAS100
NZDUSD
+15
RangeBoxFibonacci
With this Fibonacci retracement indicator, traders have full control over the retracement levels displayed on the chart.
Indicator
Indices
Prop
Stocks
+5
New Way Sar - Free
The Parabolic SAR, or "Stop and Reverse," is a dynamic technical analysis tool
Indicator
Indices
RSI
Commodities
+1
OrderPrice-V3
A straightforward yet effective tool signals entry points for both buying and selling. Include 3 Moving Average
Indicator
NAS100
RSI
NZDUSD
+18
HAIQuantum-V10
The HAI Quantum V10 is an advanced indicator designed for technical analysis
Indicator
Indices
Prop
Breakout
+7
NTNPICLL
NTNPICLL is a tool to check the best trading hours for the assets and also includes the highest and lowest point
Indicator
Indices
Prop
Stocks
+6
New Way Sar - Pro
The Parabolic SAR, or "Stop and Reverse," is a dynamic technical analysis tool
Indicator
RSI
Indices
Stocks
+3
FiboTrend-Pro V2
New version of one of my favorites includes Fibonacci and moving average convergence divergence lines
Indicator
NAS100
Indices
XAUUSD
+9
HAIQuantum_TheGameV2
This trading game allows you to explore and practice investment strategies in a real-time market data environment.
You may also like
Indicator
NAS100
NZDUSD
XAUUSD
+15
VWAP Multi Chart type
Pro M1 VWAP: Daily/Weekly/Monthly anchors with optional bands, editable colors & thickness—accurate on any chart.
Indicator
Breakout
Institutional Flow Radar
Institutional Flow Radar scans the chart for abnormal volume events and classifies them into two groups: Capital &Public
Indicator
Indices
Prop
Stocks
+3
LT_Ind_Pivot
Draws pivots (P, S/R, CPR) from selected anchors like H1–Month1, with optional mid-levels (PS1, S1S2, etc.)
Indicator
Signal
[Stellar Strategies] Wave Trend Pro
Momentum oscillator identifying reversals using dual WaveTrend lines, histogram, and OB/OS levels with optional signals.
Clarosti
Clarosti a chave para decisƵes inteligentes no mercado
Indicator
NAS100
Indices
Breakout
+6
cAlgoBuddy - Boxify
The purpose of the algorithm of the Boxify indicator is to try to put price action into zones, or better, boxes.
Indicator
Indices
Prop
Stocks
+3
4MA
This indicator consists of 3 moving averages that can be configured to your liking, from the type of moving average....
Support Resistance Zones
Support and Resistance.
Indicator
RSI
Breakout
XAUUSD
+6
Fair Value Gap Sessions
identify and highlight temporary market inefficiencies known as "fair value gaps" 🚨 within specific trading Sessions.
Repiptor RSI Amplified
RSI Amplified
Indicator
Indices
Breakout
Commodities
+3
Trend Lines Auto - FXMaster
Auto Trend Line Indicator for cTrader
Fury Team E_M_A_su_TF
EMA ON TF (MULTI-TIMEFRAME)
Renko 4k Pips
Custom your Renko Brick how do you wish!
Reversal Probability Engine
Detecting reversal zones + multidimensional mapping of support and resistance "Golden Levels.
VegaXLR - Chart Patterns Alerts
Enhance your trading strategy with automated detection and alerts for key chart patterns.
IR Candle MTF
with this indicator you could see other time frame candle in your chart.
CRT Pattern Indicator
The CRT indicator helps ICT traders identify candlestick patterns, enhancing analysis of higher timeframe on lower
IVB 2.0
IVB 2.0 is an indicator that works on the strategy of imbalance of the maximum volatility box of indices