
MACDVolume
Indicator
19 purchases
Version 1.0, Dec 2024
Windows, Mac
5.0
Reviews: 3

Description
Advanced MACD Indicator with Dynamic Color Change and Volume
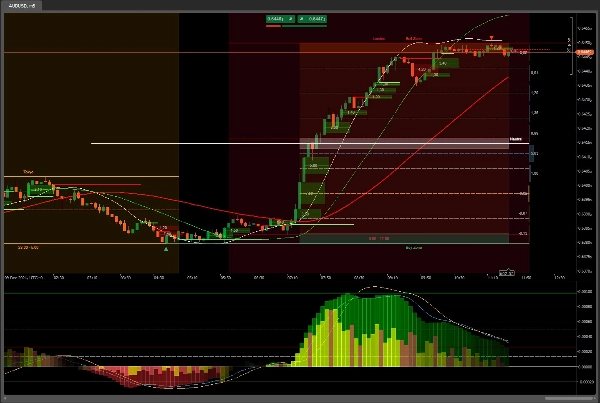
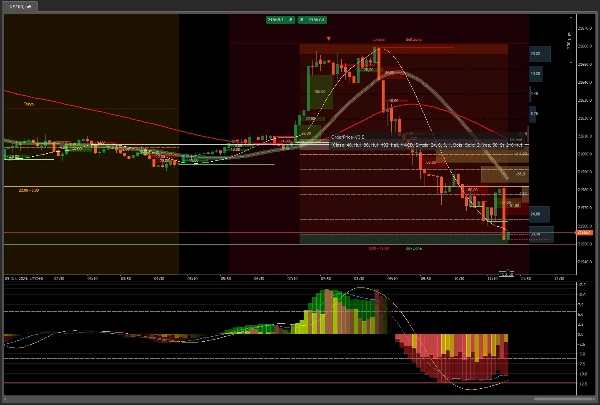
Description: Our Advanced MACD Indicator is not just a simple histogram. This indicator is designed to provide a clear and dynamic view of market trends, with unique features that make it indispensable for any serious trader.
Key Features:
- Dynamic Color Change:
- Positive: The histogram changes from green to white as values increase, providing a clear visualization of bullish trends.
- Negative: The histogram changes from red to white as values decrease, highlighting bearish trends.
- Volume Indicator:
- Positive Volume: Represented by green bars, indicating an increase in trading volume.
- Negative Volume: Represented by red bars, indicating a decrease in trading volume.
- Clear Visualization: The combination of colors in the volume bars (green, yellow, brown, red) provides a clear view of market buying and selling activity.
- Auto Zoom:
- Keeps the indicator centered and automatically adjusted for optimal viewing, without the need for constant manual adjustments.
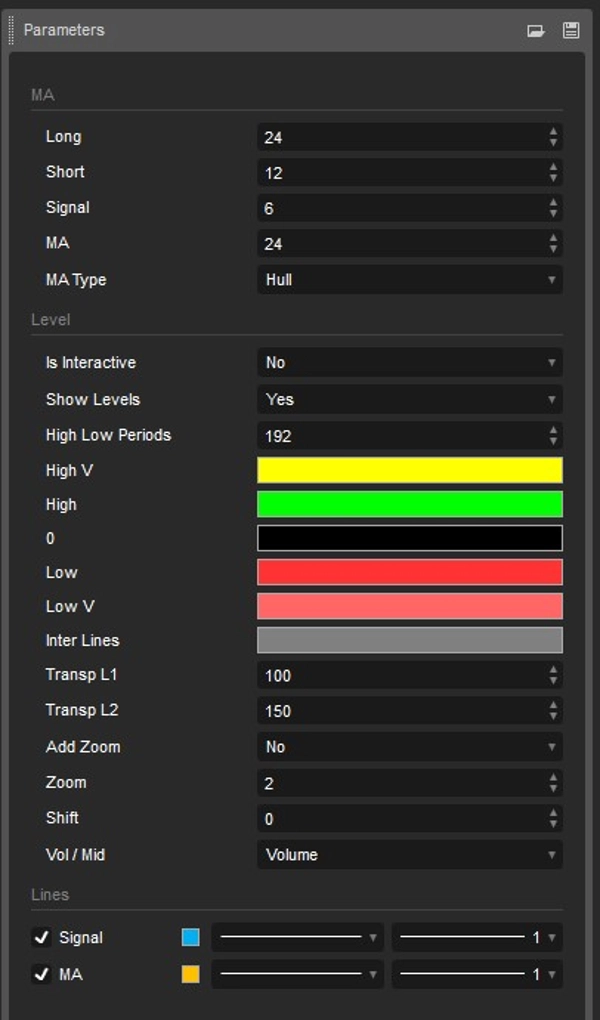
- Customizable Moving Average:
- Incorporates an additional moving average that you can select from the available options, allowing for greater customization and adaptation to your trading strategy.
- Highs and Lows:
- Displays the highest and lowest levels in the selected period, providing a clear view of market extremes.
Benefits:
- Visual Clarity: Dynamic color changes make it easy to identify trends and turning points in the market.
- Customization: The ability to select different moving averages and adjust color levels allows you to tailor the indicator to your specific needs.
- Efficiency: Auto zoom ensures you always have the best view of the indicator without the need for manual adjustments.
- Comprehensive Analysis: Including volume and high/low levels provides a more complete view of the market.
Ideal For:
- Traders looking for an advanced and customizable tool to enhance their technical analysis.
- Those who want a clear and dynamic visualization of market trends.
- Users who value efficiency and customization in their trading tools.
With additional tools like
OrderPrice V3 https://ctrader.com/products/397
NTMPICLL https://ctrader.com/products/327
Range Box Level https://ctrader.com/products/245
Or RangeBoxFibonacci https://ctrader.com/products/526
Market Session https://ctrader.com/products/525
MacdVolume https://ctrader.com/products/267
4MA https://ctrader.com/products/247
You will be invincible
Good luck 😀
Summary
AI summary
The MACDVolume indicator is an advanced technical analysis tool combining the Moving Average Convergence Divergence (MACD) histogram with volume data for enhanced market trend visualization. It features dynamic color changes in the MACD histogram: bullish trends are shown by a gradient from green to white, while bearish trends shift from red to white. The volume component uses color-coded bars—green for increasing volume and red for decreasing volume—with additional colors (yellow, brown) to clearly depict buying and selling activity.
Key functionalities include auto zoom, which keeps the indicator centered and optimally scaled without manual adjustment, and a customizable moving average that can be selected from available options to fit different trading strategies. The indicator also displays the highest and lowest price levels within the selected period, providing insight into market extremes.
Designed for traders seeking a customizable and efficient tool, MACDVolume offers clear visual cues for trend identification and comprehensive market analysis by integrating volume and price extremes. It supports markets such as Forex and Stocks and is suitable for users who prioritize clarity, customization, and efficiency in their technical indicators.
Indicator profile
Customer reviews
5.0
Reviews: 3
5 | 100 % | |
4 | 0 % | |
3 | 0 % | |
2 | 0 % | |
1 | 0 % |
Customer reviews
January 12, 2026
August 28, 2025
MACDVolume is a strong complementary tool for traders already using MACD. It enhances decision-making by incorporating volume, making signals more trustworthy.
April 17, 2025
Discussion
FAQ
Forex
Stocks
MACD
Products available through cTrader Store, including trading bots, indicators and plugins, are provided by third-party developers and made available for informational and technical access purposes only. cTrader Store is not a broker and does not provide investment advice, personal recommendations or any guarantee of future performance.


Price
147
Sales
11.19K
Free installs