"MARainbow" logo
MARainbow
"MARainbow" uploaded image
17
Sales
1.72K
Free installs
  • Transform your charts into a visual symphony of trend clarity.

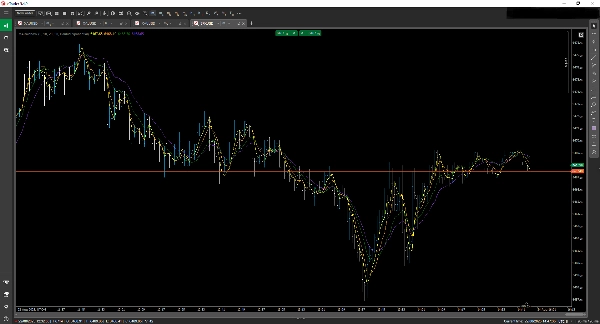
The MARainbow Indicator is a sleek, multi-layered moving average tool designed for traders who demand precision, flexibility, and aesthetic clarity. Whether you're scalping intraday moves or analyzing long-term trends, MARainbow gives you the edge with four customizable moving averages—each color-coded for instant recognition.


🔧 Key Features

Four Distinct Moving Averages

Display up to 4 moving averages simultaneously, each with its own color and period setting for quick visual differentiation.

Multiple MA Types

Choose from:

Simple Moving Average (SMA)

Exponential Moving Average (EMA)

Double Exponential Moving Average (DEMA)

And others.

Mix and match to suit your strategy.


Customizable Inputs

Select individual periods for each MA

Assign unique colors for better chart readability

Toggle visibility for each line independently


Trend Clarity at a Glance

The rainbow effect helps you instantly identify trend direction, strength, and potential reversals—no more second-guessing.


Optimized for cTrader

Seamlessly integrates with the cTrader platform, offering smooth performance and intuitive settings.

Indicator profile
0.0
Reviews: 0
Customer reviews
No reviews for this product yet. Already tried it? Be the first to tell others!
Forex
Indices
Commodities
Crypto
Stocks
Products available through cTrader Store, including trading bots, indicators and plugins, are provided by third-party developers and made available for informational and technical access purposes only. cTrader Store is not a broker and does not provide investment advice, personal recommendations or any guarantee of future performance.

More from this author

The Indicator is a powerful tool for price-action traders seeking to identify and exploit short-term imbalances.
The Smooth Heiken Ashi indicator is a refined charting tool designed to filter out market noise and highlight true price
A powerful overlay tool designed to automatically plot Fibonacci retracement levels based on a custom window.
A precision overlay tool that combines session-aware VWAP logic and standard deviations.
A next‑generation moving average designed to deliver exceptional smoothness with minimal lag.
Fractals is a precision-engineered trading indicator for cTrader that reveals the hidden architecture of price action.
Automatically calculates the previous day’s high and low, determines the range, and then projects Fibonacci levels.
A precision-crafted indicator that compares current volume to its historical average for the same time of day.
An indicator that redefines ATR by applying a percentile-based filter giving traders a grounded view of volatility.
A precision-engineered indicator designed for traders who demand signal integrity across volatile markets.
A precision tool for measuring how efficiently price moves from point A to B.
A trading robot designed for traders who want precision for high-volatility markets (XAUUSD, US500, US100, WTI, others.)

You may also like

Trailing algo 📈 auto-tracks trends 🎯 adapts to volatility 🌟 precise moves 🛡️ retest signals 🚀 no lag, smart market
Indicator for my Bot
Smoothed CCI alerts! Audio & arrow signals for +/-100 crosses. Custom sounds & arrow filters. Precision trading!
VWAP indicator
Self-adapting Kalman filter for cTrader. Smooth trend line with color shifts, optional histogram, no nag screens.
The Matrix Trend Heatmap pro, Turn your chart into a real-time market mood board — instant trend direction.
😎Read the description before purchasing💩
Daily Pivot Points plots key support and resistance levels to guide precise trading decisions.
Sero is a stochastic-based momentum oscillator that gives clear, color-coded visual signals for market momentum shifts.
Multi-timeframe pivot points with 8 support/resistance levels. Professional trading tool for precise entry/exit points.
With this Fibonacci retracement indicator, traders have full control over the retracement levels displayed on the chart.
Heatmap Pro analiza la volatilidad, el volumen y la acción del precio para "pintar" tu gráfico con zonas de color.
Adaptive trend channel using linear regression and Pearson correlation for dynamic support, resistance, and trends.
The Fair Value Gap (FVG) Indicator identifies inefficiencies in price action where an imbalance occurs due to aggressive
FREE PRICE ACTION INDICATOR. Good for beginners struggling with trend bias.
Customizable multi-timeframe pivot point indicator for cTrader with alerts, Fibonacci, CPR, and more!
Multi-asset screener with real-time RSI/volatility analysis, interactive dashboard, and color-coded trading signals.
Plots chosen symbol's close price, candlestick (wick, body) on cTrader chart, supports multiple timeframes.
17
Sales
1.72K
Free installs