

Description
🔍 Vue d'Ensemble
L'Adaptive Price Zone Oscillator (APZ) de MA Quant est une évolution moderne des oscillateurs traditionnels, conçu pour s'adapter intelligemment à la volatilité du marché. Contrairement aux indicateurs statiques, il ajuste automatiquement ses seuils selon les conditions de trading actuelles, offrant ainsi une précision exceptionnelle dans l'identification des points de retournement.
⚡ Fonctionnalités Principales
🎯 Analyse Adaptative Intelligente
- Zones de Prix Dynamiques : Calcul en temps réel des zones de sur-achat/sur-vente
- Ajustement Automatique : Adaptation à la volatilité du marché sans intervention manuelle
- Filtrage Multi-Niveau : Système de confirmation sur plusieurs périodes
- Calcul du Momentum : Intégration du momentum pour validation des signaux
🛠️ Système de Signalisation Avancé
- 3 Styles de Signaux :
- Conservateur : Signaux très forts uniquement (Force > 75%)
- Agressif : Signaux plus fréquents (Force > 25%)
- Équilibré : Compromis optimal (Force > 50%)
- Confirmation Multi-Barres : Validation sur 1 à 5 périodes
- Force du Signal : Mesure quantitative de la qualité de chaque signal
🎨 Visualisation Professionnelle
- Modes d'Affichage :
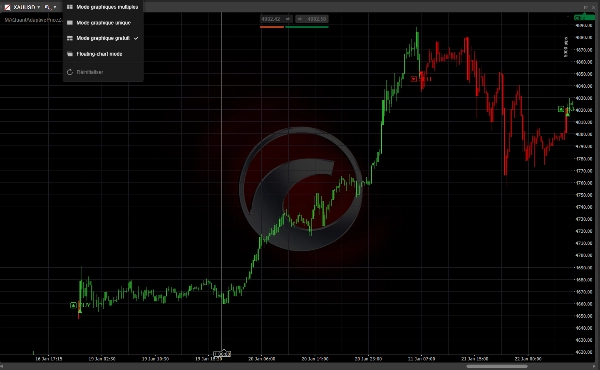
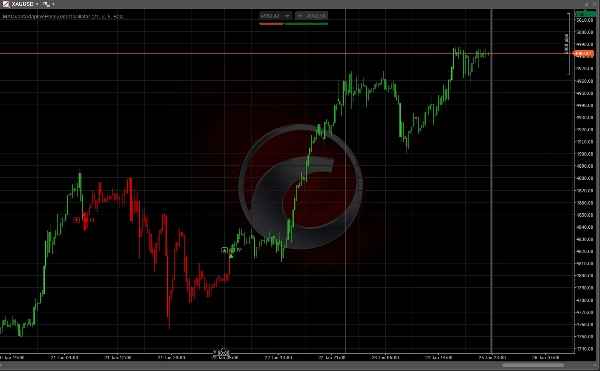
- Barres : Coloration intelligente avec gradient d'intensité
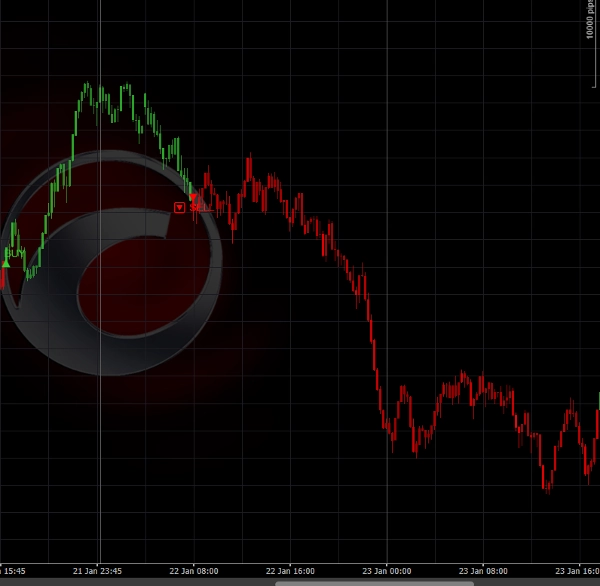
- Icônes : Triangles directionnels aux points de signal
- Combiné : Affichage simultané barres + icônes
- Signaux Texte : Labels "🔼 BUY" / "🔽 SELL" optionnels
- Couleurs Personnalisables : Palette professionnelle MA Quant
⚙️ Paramètres Techniques Avancés
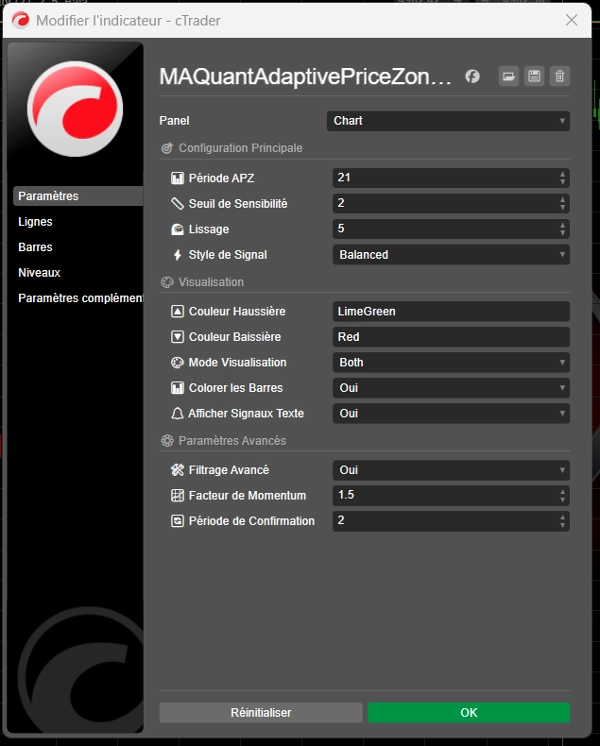
Configuration Principale
- Période APZ : 5-100 (défaut: 21) - Sensibilité de l'oscillateur
- Seuil de Sensibilité : 0.5-5.0 (défaut: 2.0) - Distance des bandes
- Lissage : 2-20 (défaut: 5) - Réduction du bruit de marché
- Style de Signal : Conservative/Aggressive/Balanced
Paramètres Avancés
- Filtrage Avancé : Confirmation multi-période activable
- Facteur de Momentum : 1.0-3.0 - Amplification selon la dynamique
- Période de Confirmation : 1-5 barres - Robustesse des signaux
🔬 Algorithme Technique
1. Calcul du Prix Typique (HLC3)
Prix Typique = (High + Low + Close) / 3
2. Mesure de Volatilité Adaptative
Volatilité = |Prix Typique[i] - Prix Typique[i-1]|
EMA Volatilité = EMA(Volatilité, Période APZ)
3. Bandes Adaptatives Intelligentes
Prix Lissé = EMA(Prix Typique, Lissage)
Seuil Ajusté = Seuil × Facteur Momentum × Ratio Volatilité
Bande Haute = Prix Lissé + (Seuil Ajusté × EMA Volatilité)
Bande Basse = Prix Lissé - (Seuil Ajusté × EMA Volatilité)
4. Détection de Tendance
Si Prix > Bande Haute[précédente] → Tendance = Haussière (+1)
Si Prix < Bande Basse[précédente] → Tendance = Baissière (-1)
Sinon → Tendance = Maintenue
5. Force du Signal
Distance Prix = |Prix - Centre Bandes|
Largeur Bandes = Bande Haute - Bande Basse
Ratio Volatilité = Volatilité Actuelle / EMA Volatilité
Force = (Distance Prix / Largeur Bandes) × Ratio Volatilité × 100
📈 Applications Pratiques
Pour le Scalping (M1-M5)
- Période APZ : 10-15
- Style : Agressif
- Confirmation : 1-2 barres
- Focus sur signaux rapides et fréquents
Pour l'Intraday (M15-H1)
- Période APZ : 21 (défaut)
- Style : Équilibré
- Confirmation : 2-3 barres
- Équilibre entre qualité et fréquence
Pour le Swing Trading (H4-D1)
- Période APZ : 30-50
- Style : Conservateur
- Confirmation : 3-5 barres
- Focus sur signaux de haute qualité
🎯 Signaux de Trading
🔼 Signaux d'Achat
- Condition : Prix casse au-dessus de la bande haute
- Confirmation : Maintien sur X périodes (paramétrable)
- Validation : Force du signal > seuil choisi
- Affichage : Triangle vert + "🔼 BUY" (optionnel)
🔽 Signaux de Vente
- Condition : Prix casse en-dessous de la bande basse
- Confirmation : Maintien sur X périodes (paramétrable)
- Validation : Force du signal > seuil choisi
- Affichage : Triangle rouge + "🔽 SELL" (optionnel)
🏆 Avantages Concurrentiels
✅ Adaptation Automatique : S'ajuste seul aux conditions de marché
✅ Filtrage Anti-Bruit : Réduit les faux signaux efficacement
✅ Mesure de Qualité : Quantifie la force de chaque signal
✅ Interface Moderne : Design professionnel avec émojis
✅ Paramétrage Flexible : 3 styles prédéfinis + personnalisation
✅ Performance Optimisée : Code C# haute performance
✅ Multi-Timeframes : Efficace du M1 au Daily
✅ Statistiques Intégrées : Suivi des performances en temps réel
💡 Innovations MA Quant
🧠 Intelligence Adaptative
- Ajustement automatique selon la volatilité historique vs actuelle
- Facteur de momentum pour amplifier les signaux dans les tendances fortes
- Système de confirmation multi-période pour réduire les whipsaws
🎨 Visualisation Avancée
- Gradient de couleurs selon la force du signal
- Interface utilisateur avec émojis pour clarté immédiate
- Statistiques en temps réel avec compteurs de signaux
⚙️ Paramétrage Intelligent
- Groupes logiques de paramètres pour navigation facile
- Styles prédéfinis (Conservateur/Agressif/Équilibré)
- Options avancées pour traders expérimentés
📚 Guide d'Utilisation Rapide
- Installation : Charger l'indicateur sur cTrader
- Configuration de Base :
- Période APZ : 21
- Style : Équilibré
- Visualisation : Both (barres + icônes)
- Première Analyse : Observer les signaux sur graphique H1
- Optimisation : Ajuster selon votre style de trading
- Confirmation : Valider avec d'autres indicateurs
- Exécution : Trader sur les signaux confirmés
- Suivi : Monitorer les statistiques en temps réel
🔧 Paramètres Recommandés
Configuration Conservative
Période APZ: 30
Seuil: 2.5
Style: Conservative
Confirmation: 3-5 barres
Configuration Aggressive
Période APZ: 15
Seuil: 1.5
Style: Aggressive
Confirmation: 1-2 barres
Configuration Balanced
Période APZ: 21
Seuil: 2.0
Style: Balanced
Confirmation: 2-3 barres
📊 Métriques de Performance
L'indicateur suit automatiquement :
- Nombre de signaux haussiers générés
- Nombre de signaux baissiers générés
- Index et prix du dernier signal
- Force moyenne des signaux
- Statistiques affichées à la fermeture
🔬 Base Scientifique
L'APZ MA Quant s'appuie sur plusieurs concepts financiers établis :
- Volatilité Adaptative : Ajustement selon l'ATR dynamique
- Mean Reversion : Retour à la moyenne avec bandes mobiles
- Momentum Analysis : Confirmation par analyse directionnelle
- Signal Filtering : Réduction du bruit par agrégation temporelle
🏷️ Licence : Creative Commons Attribution-NonCommercial-ShareAlike 4.0
👨💻 Développeur : MA Quant (Enhanced from QuantAlgo original)
🔄 Version : 2.0 Professional
📅 Date : Janvier 2026
"Adaptive intelligence meets professional trading - Experience the future of market analysis"
Summary
Key features include:
- Dynamic price zones adjusting automatically to current market conditions without manual input.
- Multi-level filtering with confirmation across 1 to 5 bars to reduce false signals.
- Three signal styles (Conservative, Balanced, Aggressive) based on signal strength thresholds.
- Visual display options combining color-coded bars, directional triangles, and optional text labels ("🔼 BUY" / "🔽 SELL").
- Advanced parameters for sensitivity, smoothing, momentum factor, and confirmation period customization.
- Real-time performance metrics tracking signal counts, strength, and last signal details.
The indicator supports multiple timeframes from 1-minute scalping to daily swing trading, with recommended presets for each style. It is based on established financial concepts including adaptive volatility (ATR-based), mean reversion, momentum confirmation, and temporal signal filtering. The implementation uses high-performance C# code and offers a professional user interface with customizable color palettes and emoji-enhanced clarity.
Markets supported include Forex, indices, commodities, cryptocurrencies, and stocks, with tags indicating symbols like BTCUSD, EURUSD, GBPUSD, XAUUSD, NAS100, and USDJPY.
Customer reviews
5 | 0 % | |
4 | 100 % | |
3 | 0 % | |
2 | 0 % | |
1 | 0 % |



!["Smart Money Concepts (SMC) [Iridio Capital]" logo](https://cdn.ctrader.com/image/webp/b4b5414d-a5ca-44b7-a947-e28eca44a218_61548)








!["[Hamster-Coder] Bollinger Bands" logo](https://cdn.ctrader.com/image/webp/21d8e5d6-fb11-4bac-b9ee-cd05c2b76804_30327)




