
Description
🚀 10,000+ traders already use our TOP indicators🏆
Discover why professionals choose us – the most powerful tools on cTrader (indicators, algorithms, and cBots) are waiting for you.
👉 Get all our TOP systems here:
_______________________________________________
📌 Market Structure Indicators
· ✅ AdvancedMarket Structure: Bos, Choch, SwinLevels, Order Blocks, Market Structure& Liquidity Finder
· 🔄 Dynamic Market StructureAnalysis of Turning Points
· 🧱 Order Block
· ⚖️ Market Imbalance
· ⛓️ BOS & CHOCH
· 🧠 ICT Power of 3
_______________________________________________
🔚 Smart Exit Systems
_______________________________________________
📐 ZigZag Indicators
· 🔍 ZigZag Price LiquidityProjection
· ➖ ZigZag
_______________________________________________
🧱 Support & Resistance Indicators
· 🟩 SmartTrend Support &Resistance Lines
· 🧱 All Support and ResistanceLevels
_______________________________________________
📊 Trend & Channel Indicators
· 📊 Supertrend
_______________________________________________
💧 Volume & Liquidity Tools
_______________________________________________
⚡ Momentum & RSI Indicators
· 🔎 Multi-Level Candle Bias
Tracker
_______________________________________________
🔮 Prediction & Projection Tools
· 📐 Prediction Based on Linreg& ATR
· 📏 Fibonacci Linear RegressionMulti-timeframe
· 📈 Volume-Powered Market Flow Projector
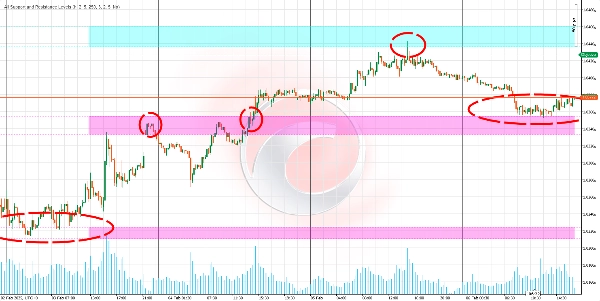
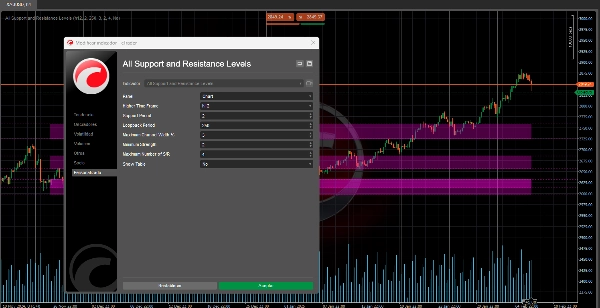
This algorithm is an advanced support and resistance indicator designed to help you identify key levels in the market.
Its main advantage is that it allows you to view support and resistance levels from any timeframe (such as daily, weekly, or monthly) directly on the chart you’re analyzing, even if it’s on a different timeframe (e.g., 15 minutes or 1 hour). 📊⏰
What’s it for? 🎯
Identify key market zones:
- Detect levels where the price might stop, bounce, or break with strength. 🛑↗️↘️
- Helps you make more informed decisions on entries, exits, and stop-losses. 💡📈📉
Analyze multiple timeframes without switching charts:
- View important levels from higher timeframes (like daily or weekly) while trading on lower timeframes (like 15 minutes or 1 hour). 🕒📅
- Gives you a broader market view without constantly switching charts. 🌍🔍
Prioritize significant levels:
- The indicator ranks support and resistance levels based on their "strength," meaning how often the price has interacted with them in the past. 💪📊
- This helps you focus on the most relevant and reliable levels. 🎯✅
How does the logic work? 🧠⚙️
Data Collection:
- The indicator takes the high and low prices from a specific timeframe (daily, weekly, etc.). 📈📉
- This data is used to search for key patterns in price behavior. 🔍📊
Detection of key points (pivots):
- It identifies local highs and lows—points where the price has reached a peak or valley compared to nearby prices. ⛰️🌄
- These points are candidates to become support or resistance levels. 🎯📌
Grouping levels:
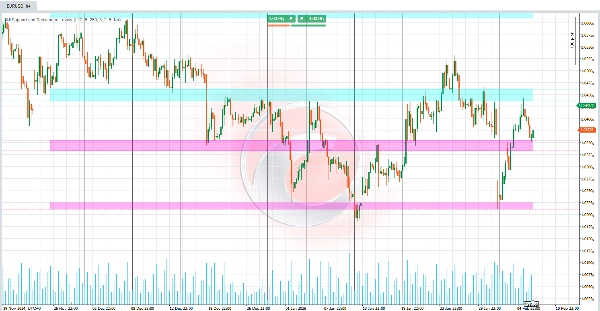
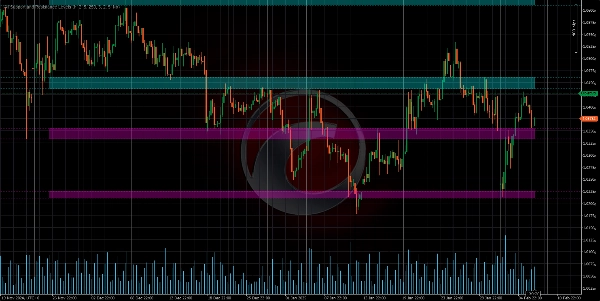
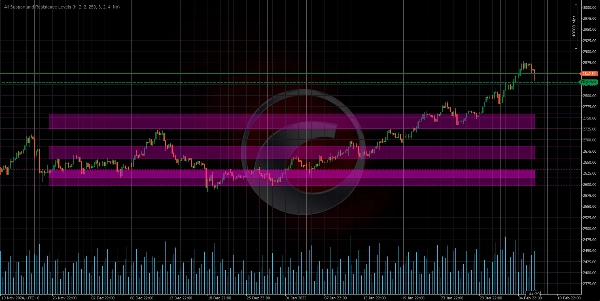
- Nearby levels are grouped to form support or resistance zones, rather than exact lines. 🟦🟧
- This reflects the idea that support and resistance are areas, not precise points. 📏🎯
Level strength calculation:
The "strength" of a level is determined by two factors:
- Frequency of touches: How many times the price has touched or come close to that level in the past. 🔄📊
- Clustering of key points: How many highs or lows are near that level. 🔗📈
Levels with greater strength are considered more significant. 💪🎯
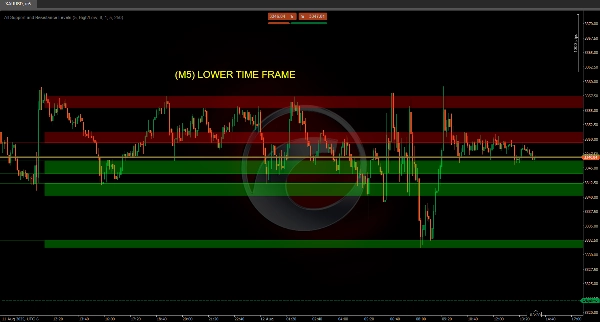
Chart visualization:
- Levels are drawn as horizontal lines or colored zones on the chart. 🎨📊
- The color of each level depends on the current price position:
- Resistance: If the price is below the level. 🔴
- Support: If the price is above the level. 🟢
- Within the range: If the price is inside the level’s range. 🟡
How can you view different timeframes on your chart? 🕒📊
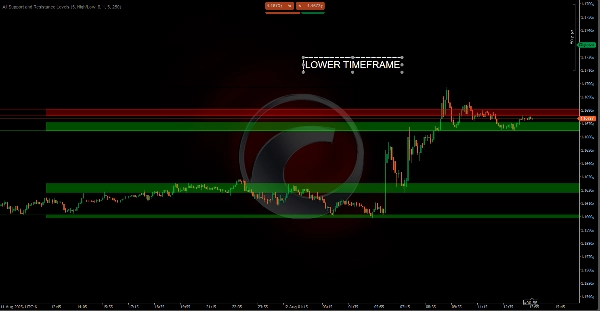
Support and resistance from higher timeframes on lower timeframe charts:
- For example, if you’re analyzing a 15-minute chart, the indicator can show key levels from the daily or weekly timeframe. 🕒📅
- This lets you see important higher-context levels without leaving your current chart. 🌍🔍
Support and resistance from lower timeframes on higher timeframe charts:
- Although less common, you can also view levels from smaller timeframes (like 1-minute or 5-minute) on higher timeframe charts (like daily or weekly). 🕒📅
- This can be useful for more detailed analysis within a broader context. 🔍📊
Summary
The indicator analyzes price data by collecting highs and lows from specified timeframes, identifying local pivot points where price peaks or valleys occur. These points are grouped into zones representing support or resistance areas rather than precise lines. Each level is assigned a strength score based on the frequency of price touches and the clustering of key points, helping users prioritize the most significant and reliable levels.
Visualized on the chart as horizontal lines or colored zones, the indicator uses color coding to indicate the price's position relative to each level: red for resistance (price below level), green for support (price above level), and yellow when price is within the level’s range. This tool assists traders in making informed decisions on entries, exits, and stop-loss placements by highlighting where price may stop, bounce, or break with strength.
Customer reviews
5 | 50 % | |
4 | 0 % | |
3 | 0 % | |
2 | 0 % | |
1 | 50 % |


