True Trend H4
"True Trend H4" logo
03/09/2025
1
Desktop
Since 28/05/2025
Sales
1

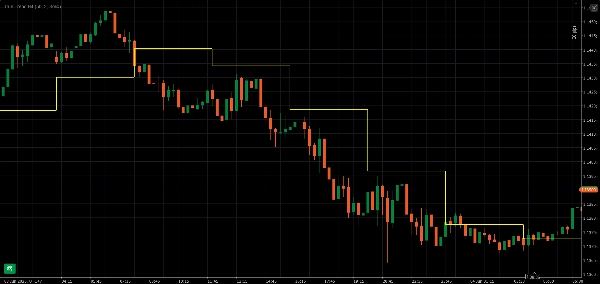
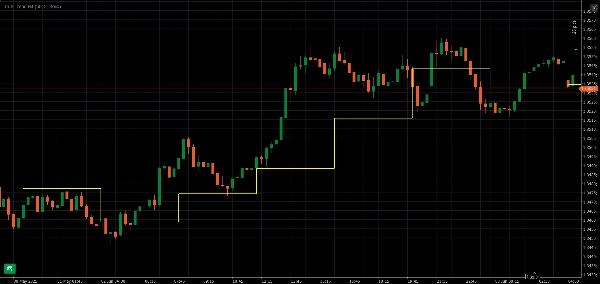
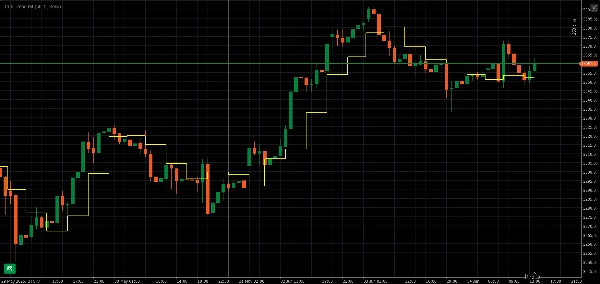
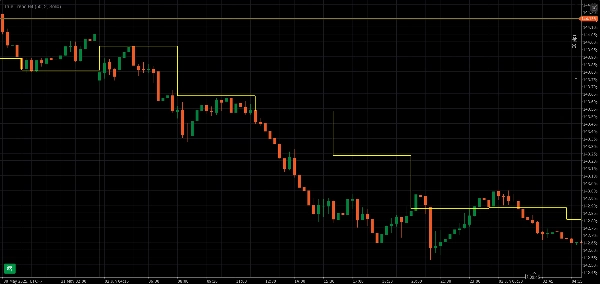
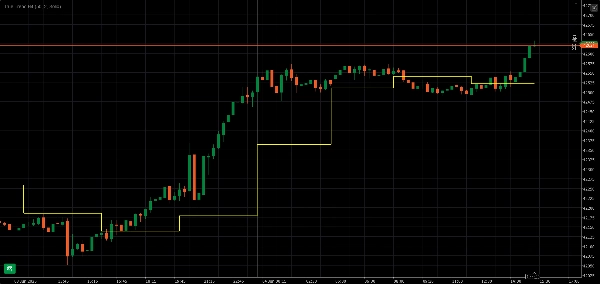
The True Trend H4 indicator uses a step line to provide a clear sense of the H4 trend direction. You can see it very well on smaller timeframes like M1, M5, M15, M30 and H1.


0.0
Reviews: 0
Customer reviews
No reviews for this product yet. Already tried it? Be the first to tell others!
You may also like
Quantitative Qualitative Estimation
The QQE (Quantitative Qualitative Estimation) Weighted Oscillator improves its original version by weighting the RSI.
Indicator
Breakout
Forex
On Balance Volume
On Balance Volume (OBV) measures buying and selling pressure as a cumulative indicator.
Indicator
Grid
RSI
XAUUSD
+12
PFO Price Flow Oscillator
technical analysis tool designed to provide traders with a structured view of market momentum and volatility
Indicator
NAS100
Indices
XAUUSD
+6
cAlgoBuddy - Boxify
The purpose of the algorithm of the Boxify indicator is to try to put price action into zones, or better, boxes.
E7 Harmonic Structures Basic
E7 Harmonic Structures Basic.
Indicator
NAS100
NZDUSD
Martingale
+26
Support & Resistance Pro
The Support & Resistance Pro helps traders identify key support and resistance levels for informed trading decisions.
Fisher_m11
Fisher Transform with smoothing. Spot reversals and cycles with precision. Great for any market, any timeframe.
FlexVWAPBand
Ultra-Flexible VWAP Indicator with Advanced Customization
EMA UP&DOWN 2025
SectorIndex Dual Moving Average Indicator: Your Market Compass 🧭
Indicator
Breakout
XAUUSD
Commodities
CursorByte.SupportResistance v3
Draws support and resistance on all pairs. Multi-timeframe support.
Indicator
Breakout
AI
Scalping
KaufmanEfficiencyRatio
A precision tool for measuring how efficiently price moves from point A to B.
BLOCK LIQUIDITY PRO
Block Liquidity,indicator.Block Order, Liquids Stops, Signal Sentiment,signal correctio.
Indicator
RSI
MACD
Multi-Timeframe Market Levels
Unlock market insights with our Multi-Timeframe Market Levels indicator, enhancing your trading strategies effortlessly
Market Polarity Zones
implifies market analysis by automatically identifying bullish 🚀 or bearish 🐻 phases and marking key levels where ....
SwingHighLow
Auto-detect swing highs/lows. Spot reversals, map structure, and filter noise with adjustable strength.
SmartArrows AI V2
High-Performance Renko Chart Indicator with Advanced AI Filtering.
Indicator
NAS100
RSI
NZDUSD
+15
Inside Candle
Highlight market consolidation zones instantly with this Inside Candle indicator — precise, clean, and powerful.
Indicator
Indices
RSI
XAUUSD
+7
RSI Divergence
Detects bullish and bearish divergences