Trading product for Bollinger Bands Advanced Indicator Bollinger Bands Channel, image 1
Indicator
2 purchases
Version 1.0, Apr 2026
Windows, Mac
4.0
Reviews: 2
Trading product for Bollinger Bands Advanced Indicator Bollinger Bands Channel, image 2
Trading product for Bollinger Bands Advanced Indicator Bollinger Bands Channel, image 3
Trading product for Bollinger Bands Advanced Indicator Bollinger Bands Channel, image 4
Trading product for Bollinger Bands Advanced Indicator Bollinger Bands Channel, image 5
Trading product for Bollinger Bands Advanced Indicator Bollinger Bands Channel, image 6
24
Sales
635
Free installs

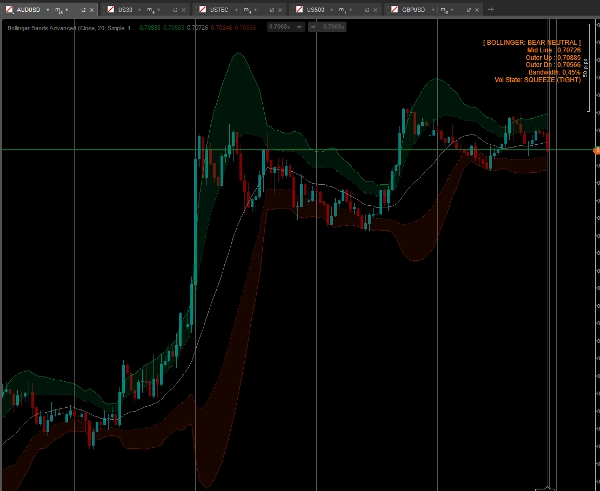
Bollinger Bands Advanced Squeeze & Breakout System

The Bollinger Bands indicator is a staple for volatility traders, but standard bands leave out critical context: Is the market squeezing? Is the trend strong enough to ride? Is the move overextended?

The Bollinger Advanced indicator transforms standard bands into a highly visual, professional-grade trading system. By introducing Dual Action Zones (Clouds), an automatic Volatility Squeeze Detector, and Smart Paintbars, it gives you a massive edge in catching explosive breakouts and timing perfect mean-reversion entries.

Key Features

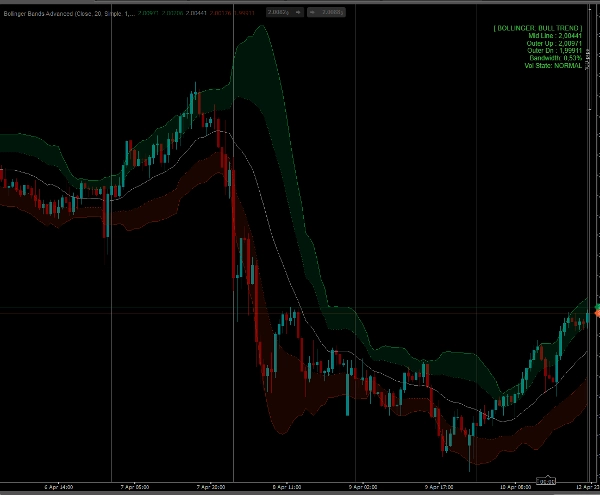
  • Dual-Band Cloud System (Action Zones): Instead of a single outer band, this indicator plots an Inner Band (e.g., 1 Standard Deviation) and an Outer Band (e.g., 2 SD). The space between them is shaded as a Cloud.
    • Price inside the Cloud? You are in the "Trend Zone". Ride the momentum!
    • Price between the Mid-Line and Inner Band? You are in the "Neutral Zone". Wait for a setup.
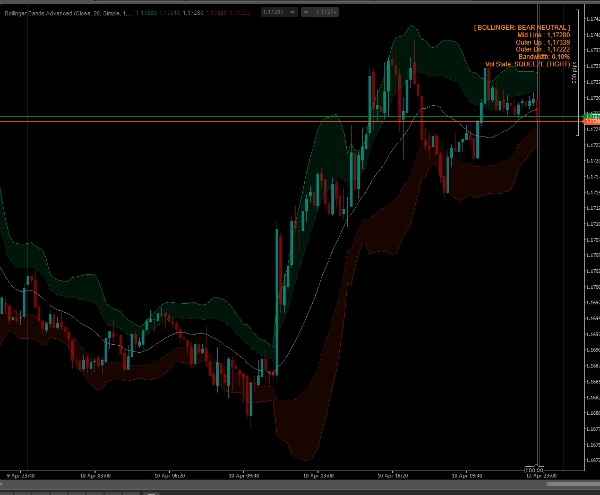
  • Auto-Squeeze Detector: The indicator constantly calculates the Bollinger Bandwidth and compares it to a historical moving average. The on-chart dashboard will flash a bright orange "SQUEEZE (TIGHT)" alert when the bands contract abnormally, warning you of an impending explosive breakout!
  • Smart Bar Coloring (Paintbars): Your candlesticks change color based on volatility and band location:
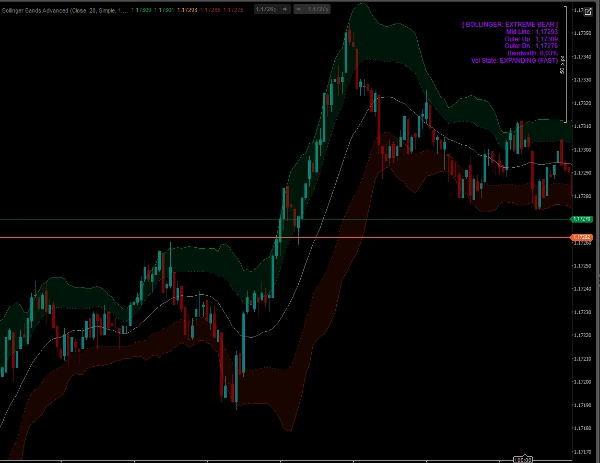
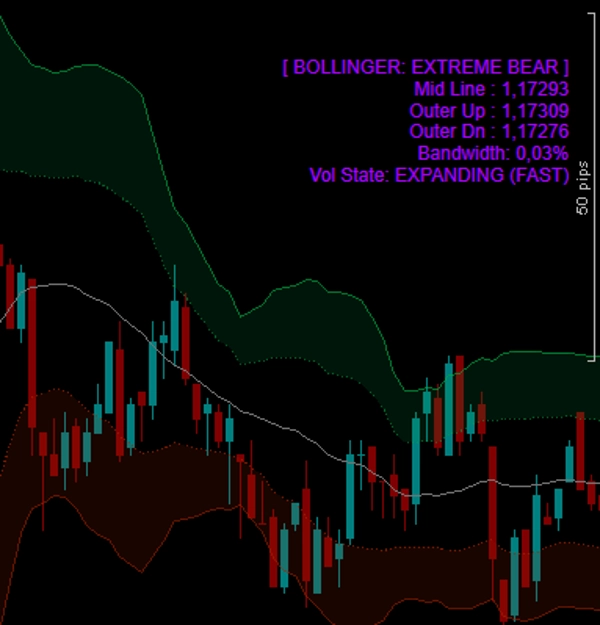
    • Neon Purple/Magenta (Extreme): Price closes outside the Outer Band. A sign of a massive breakout or an overextended climax.
    • Bright Green/Red (Trend): Price is actively pushing inside the Cloud Action Zone.
    • Dark Green/Red (Neutral): Price is pulling back toward the moving average.
  • Real-Time On-Chart Dashboard: A sleek panel displays the exact Band levels, current Bandwidth percentage, Market State, and Volatility State (Squeezing, Normal, or Expanding).
  • Completely Unlocked: Trade on ANY symbol (Forex, Crypto, Indices, Stocks) and ANY timeframe with zero limitations. Lifetime access.

How to trade with it?

  1. The Breakout (Squeeze Play): Look at the dashboard. When the Volatility State says "SQUEEZE", the market is storing energy. Wait for a candle to burst into the Cloud zone and paint Bright Green/Red. This is your trigger to enter a high-momentum breakout.
  2. Trend Riding: Stay in your trade as long as the candles remain Bright Green/Red and hug the outer Cloud.
  3. Mean Reversion: When a long trend pushes the price completely outside the Outer Band (candle turns Purple) and the dashboard says "EXPANDING (FAST)", the market is rubber-banded too far. Look for reversal price action back to the Mid-Line.
Indicator profile
Indicator category
Volatility
Output type
Signals
Visualisation
Filter
Data requirements
Bars only
Supported signals
Breakout
Trend strength
Volatility
4.0
Reviews: 2
5
0 %
4
100 %
3
0 %
2
0 %
1
0 %
Customer reviews
April 20, 2026
demo first, then maybe small size if the notes look sane. The setup needs patience.
April 18, 2026
Bollinger Bands
Channel
ATR
Products available through cTrader Store, including trading bots, indicators and plugins, are provided by third-party developers and made available for informational and technical access purposes only. cTrader Store is not a broker and does not provide investment advice, personal recommendations or any guarantee of future performance.

More from this author

Indicator
AI
Prop
+8
The EMA Trend Simple is a trend-following tool designed for simplicity and visual clarity.
Indicator
ATR
MACD
+15
MACD Advanced -- It combines the standard MACD logic with a rich set of visual tools
Indicator
AI
Grid
+7
Follow The Trend cBot - INDICATOR - displays two Moving Average Bands for cBot or for your own use
Indicator
AI
SMC
+7
The ultimate tool for Price Action and ICT. High, Low and Mid levels for days, weeks Inc. NY Midnight and Custom Range.
Indicator
ATR
Prop
+13
HCCC MTF (Hurst Cycle Composite Channel), Designed for Semi-Automated Trading, Interactive MTF Dashboard
cBot
Prop Firm Fit
Stop Loss (SL) Manager
+1
HTS Strategy Tester - Advanced Multi-Timeframe Trend & Pullback Trading System H1/m1 & H4/m5 WWS 33/144 Start from 100$
90.1%
ROI
2.92
Profit factor
Indicator
AI
RSI
+7
EMA MTF TREND PRO - Multi-timeframe trend analysis overlay indicator, 6 timeframes - in one table with ADX
Indicator
AI
Prop
+7
EMA Clouds, Multi-Timeframe (MTF) Overlay, Swing High/Low detection, and a smart Dashboard with neutral zone filtering.
Indicator
AI
SMC
+4
Weekly Daily Opening Gaps — NWOG & NDOG Indicator Professional-grade opening gap visualization for institutional traders
Indicator
AI
ATR
+12
The standard Relative Strength Index (RSI), RSI & Signal Cloud, Smart Volatility Filter (ATR), On-Chart Info Dashboard
Indicator
SMC
Prop
+11
Sessions PRO is a professional session visualization indicator - 4 Fully Customizable Sessions
cBot
ATR
EMA
+5
FOLLOW THE TREND XAU EDITION v3.0, Start with $500, AI features BE & TP50%, cbot management simplified
36.2%
ROI
5.09
Profit factor

You may also like

Indicator
BOS
Key Levels
+4
Automatically plots the Opening Range Breakout (ORB) box for all 3 major session: Asia, London and New York
Indicator
Spread Filter
SpreadSync Entry Timer is a compact cTrader indicator that shows live spread and candle-close.
Indicator
AI
ATR
+27
Nadaraya-Watson Envelope Indicator
Indicator
The Multi-Timeframe Candle Indicator displays candles from multiple timeframes in one window, enhancing market analysis!
Indicator
SMC
Prop
+7
institutional-level market analysis
Indicator
AI
ATR
+27
Smart Money Gaps: MTF FVG auto-detection, extension, and mitigation marker. Trade institutional imbalances.
"ORB v1.1" logo
Popular
4.0
(3)
$25
Indicator
Breakout
Opening Range Breakout v1.1 - Visuals + Stats
Indicator
AI
ATR
+27
VolumeProfileSuite is an advanced and flexible Volume Profile indicator for cTrader.
Indicator
ATR
MACD
+15
Professional trading indicator: 5 cloud types, 9 ML engines, SMC Order Blocks, Pandas-TA & live dashboard.
Indicator
ATR
A lightweight Multi Time Frame bias dashboard for quickly spotting market direction across multiple timeframes.
Indicator
ATR
Market Structure
+3
Support Resistance Toolkit
Indicator
Imbalance
Supertrend
+5
Colorea las velas automáticamente según los niveles máximos, mínimos y de cierre previos para definir tendencias.
Indicator
ATR
RSI
+16
This trading game allows you to explore and practice investment strategies in a real-time market data environment.
Indicator
MACD
Prop
+14
Enhance MACD Histogram! Visualize bull and bear price changes with vibrant colors for clearer, more insightful trading.
Indicator
Forex
BTCUSD
+10
🎯Smart Signals : Auto Buy/Sell alerts with dynamic TP/SL algorithm. 💡
Indicator
ATR
RSI
+6
Market structural patterns , specifically the concepts of Change of Character (ChoCH) 🔄 and Break of Structure (BoS) 💥
Indicator
ATR
Forex
+5
Most used candle patterns. (1 candle, 2 candles and 3 candles patterns) and Marubozu. Bonus Fibo Risk control.
Indicator
Allow trader to draw multi trendlines in different timeframes on one chart,Give trader an overview of the current market
24
Sales
635
Free installs