
Volume Profile Triple Line - POC Median Mode
Indicator
4 purchases
Version 1.0, Feb 2025
Windows, Mac
4.0
Reviews: 2
Description
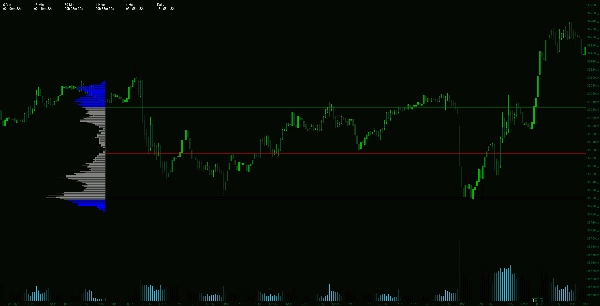
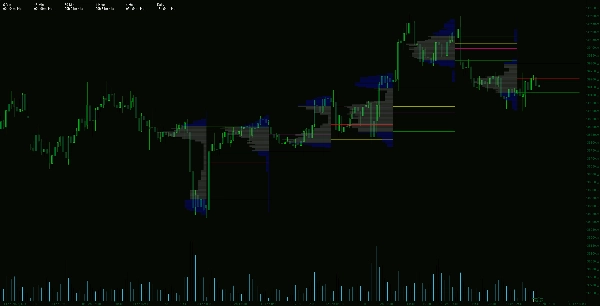
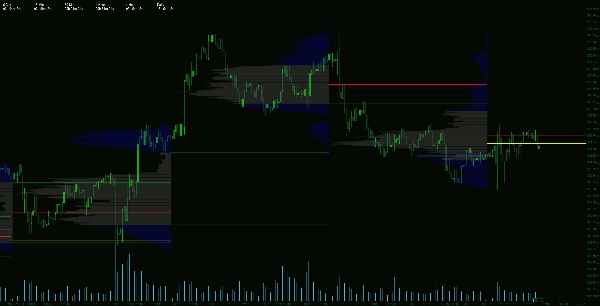
The Advanced Volume Profile Indicator is a professional trading tool designed to provide deep market insights through volume analysis. It calculates the Point of Control (POC), Median, and Mode, offering a precise view of price levels where significant market activity occurs.
Key Features:
Summary
AI summary
The Advanced Volume Profile Indicator is a professional trading tool that analyzes market volume to identify key price levels. It calculates the Point of Control (POC), Median, and Mode, highlighting price points with the highest traded volume and providing statistical insights into price balance and trend strength. The indicator displays the previous day's volume distribution and volume curve, then projects key levels such as Value Area High (VAH), Value Area Low (VAL), POC, Median, and Mode onto the following day. This helps traders identify support and resistance zones, volume gaps, and areas of accumulation or distribution. By leveraging volume-based data, users can refine trade entries, exits, and stop-loss placements for improved market positioning. The indicator requires significant memory resources due to its detailed volume distribution calculations.
Indicator profile
Customer reviews
4.0
Reviews: 2
5 | 0 % | |
4 | 100 % | |
3 | 0 % | |
2 | 0 % | |
1 | 0 % |
Customer reviews
February 26, 2025
A few ugly trades are useful in the sample, and the log becomes easier to read.
February 20, 2025
It becomes more useful when fewer random clicks reach the trade log, and 20 reactions is a fair first sample.
Discussion
FAQ
Products available through cTrader Store, including trading bots, indicators and plugins, are provided by third-party developers and made available for informational and technical access purposes only. cTrader Store is not a broker and does not provide investment advice, personal recommendations or any guarantee of future performance.


Price
Since 14/01/2025
55
Sales
11.5K
Free installs