
session indicator
Indicator
7 purchases
Version 1.0, May 2025
Windows, Mac
4.3
Reviews: 3
Description
Visualize Key Market Sessions + High/Low Levels with Precision
The Trading Sessions Indicator highlights the most important trading sessions — London, New York, and Tokyo — directly on your chart. Whether you're a scalper or swing trader, knowing when volatility spikes or fades is crucial. This tool provides that edge with clarity.
✅ Key Features:
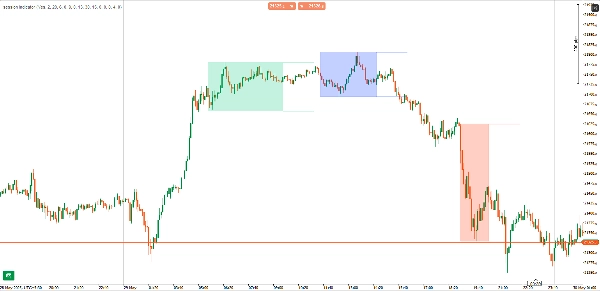
- Session Rectangles: Visually highlight each session with optional shaded boxes
- High/Low Lines: Plot session highs and lows with customizable extension length
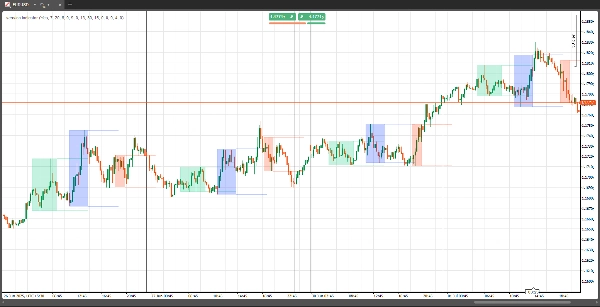
- Historical View: View session data for the current day or any number of previous days
- Fully Customizable: Set session start/end times, toggle rectangles on/off, and define how far lines extend
- Multiple Timeframe Support: Works on all chart timeframes
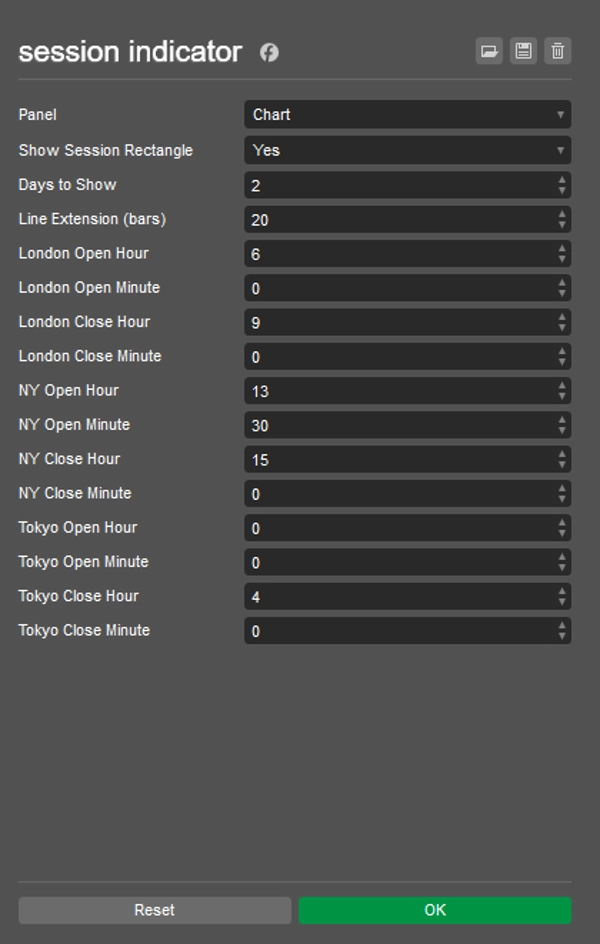
🔧 Parameters:
- Session Times: Custom start/end time for London, NY, and Tokyo
- Show Rectangle: Toggle shaded session boxes
- Days to Show: Number of historical days to display session data
- Line Extension Bars: Control how far session high/low lines extend on the chart
🧠 Why Use It?
Understanding session-based volatility patterns is a cornerstone of institutional trading. This indicator helps you:
- Time entries and exits around key liquidity zones
- Identify session highs and lows for breakout or reversal strategies
- Visually separate session overlaps (e.g., London–NY)
Summary
AI summary
The Session Indicator is a charting tool designed to highlight key global trading sessions—London, New York, and Tokyo—directly on trading charts. It visually marks each session with optional shaded rectangles and plots session high and low price levels, with customizable line extension lengths. Users can view session data for the current day or multiple previous days, supporting analysis across various timeframes.
Key features include full customization of session start and end times, toggling of session rectangles, and control over how far high/low lines extend. The indicator works on all chart timeframes and helps traders identify volatility patterns associated with institutional trading sessions.
This tool aids in timing entries and exits around key liquidity zones, recognizing session highs and lows for breakout or reversal strategies, and visually distinguishing overlapping sessions such as London-New York. It supports markets including Forex, indices, and major symbols like NAS100. The indicator outputs visual signals based on market structure concepts and is suitable for traders employing reversal strategies.
Indicator profile
Indicator category
Market structure (SMC)
Output type
Visualisation
Data requirements
Bars only
Supported signals
Reversal
Customer reviews
4.3
Reviews: 3
5 | 67 % | |
4 | 0 % | |
3 | 33 % | |
2 | 0 % | |
1 | 0 % |
Customer reviews
June 2, 2025
Useful setup helper for traders who care about timing windows. It gives value around session timing, but the value depends on the trader's schedule. I would compare Asia range, London break and New York continuation before trusting it. The tool is most useful when it keeps the trader out of dead hours.
June 1, 2025
June 1, 2025
Decent trade support for session timing. it helps match setups with active market hours, especially when used for planning trades around active sessions. The session view is useful for London and New York, especially when checking the first 60 minutes. The tool is most useful when it keeps the trader out of dead hours.
Discussion
FAQ
Prop
Forex
Indices
Fair Value Gap
SMC
NAS100
Products available through cTrader Store, including trading bots, indicators and plugins, are provided by third-party developers and made available for informational and technical access purposes only. cTrader Store is not a broker and does not provide investment advice, personal recommendations or any guarantee of future performance.


Price
Since 30/05/2025
40
Sales