

Liquidity and IFVG
Indicator
1 purchases
Version 1.0, Jun 2026
Windows, Mac
Since 30/05/2025
42
Sales
Description
Key Features
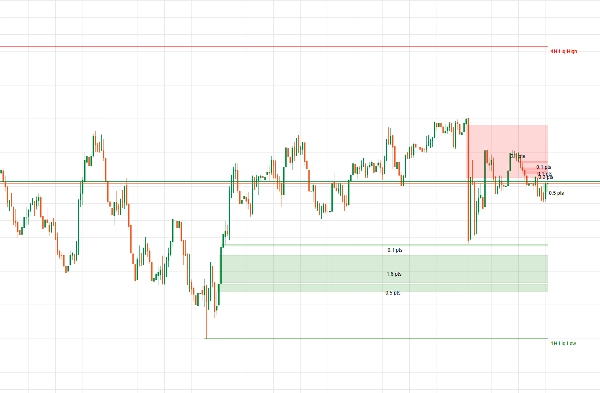
- Multi-Timeframe Liquidity: Automatically draws 1H and 4H structural high/low levels onto your lower timeframe charts. When price sweeps these levels, they either erase instantly or freeze to mark the stop-run.
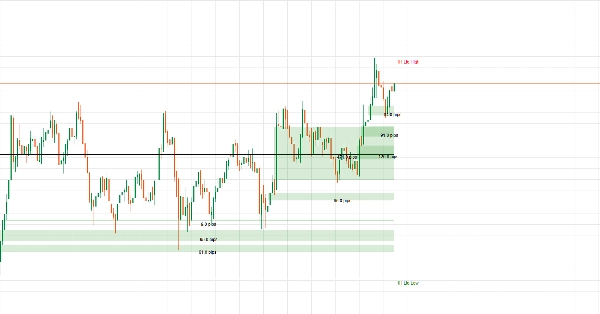
- Smart FVG & Inversion Blocks: Draws Fair Value Gaps as solid, filled color boxes instead of hollow lines. Gaps extend forward indefinitely until a candle close breaks completely through them (Inversed FVG).
- Precise Pip Counter: Displays the exact size of each gap down to a single decimal place (e.g.,
14.3 pips) so you can instantly gauge the size of the market imbalance. - 50% Daily Equilibrium Zone: Plots the active day's High, Low, and exact 50% Midpoint (resetting at the 17:00 CST / 22:00 UTC banking rollover) to show you if price is in a Premium or Discount zone.
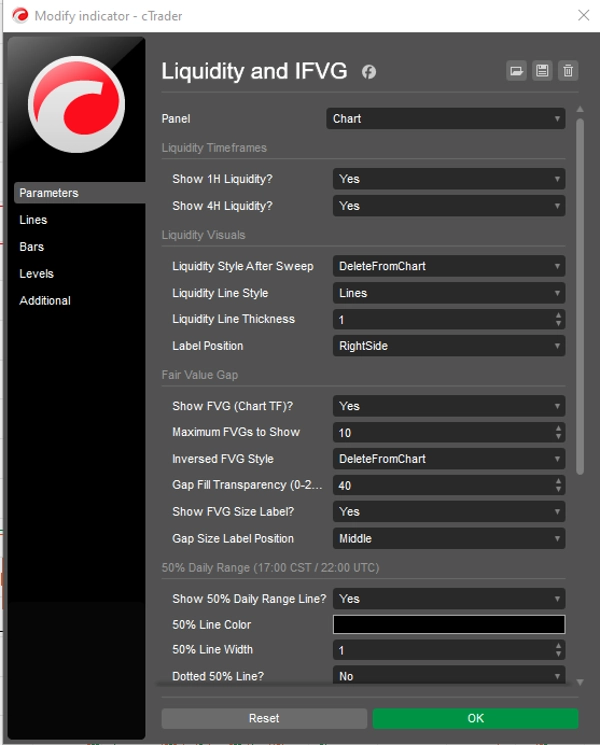
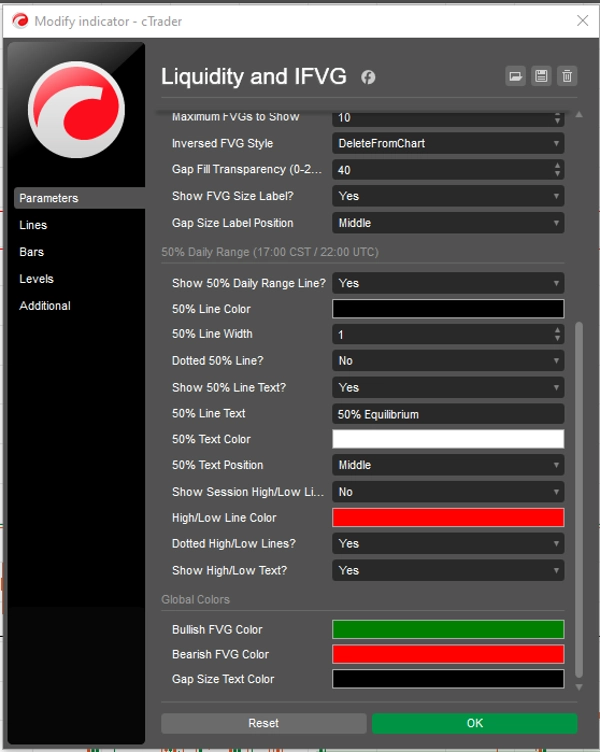
- Complete Performance Control: Includes built-in dropdown color pickers, adjustable background box opacities, 3-way text alignments, and an FVG cap count parameter to keep your platform running fast.
Summary
AI summary
This indicator integrates Multi-Timeframe Liquidity tracking, dynamic Fair Value Gap (FVG) visualization, and a 50% Daily Range equilibrium zone to assist market structure analysis. It automatically plots 1-hour and 4-hour structural high and low levels on lower timeframe charts, highlighting liquidity sweeps that either erase or freeze to indicate stop-run events. Fair Value Gaps are displayed as solid, filled color boxes extending forward until fully broken by candle closes, with precise pip measurements provided for each gap to quantify market imbalances. The indicator also marks the active day's High, Low, and exact 50% midpoint, resetting daily at the 17:00 CST/22:00 UTC banking rollover, to identify premium and discount price zones. Users can customize visual elements including color schemes, background opacity, text alignment, and set a cap on the number of FVGs displayed to optimize performance. This tool supports visualization outputs and is designed for use with bar and tick data, aiding in reversal signal identification within market structure and smart money concepts frameworks.
Indicator profile
Indicator category
Market structure (SMC)
Output type
Visualisation
Data requirements
Bars only
Tick data
Supported signals
Reversal
Customer reviews
0.0
Reviews: 0
Customer reviews
No reviews for this product yet. Already tried it? Be the first to tell others!
Discussion
FAQ
Premium/Discount
Fair Value Gap
Key Levels
Liquidity Sweep
Imbalance
Liquidity Grab
Products available through cTrader Store, including trading bots, indicators and plugins, are provided by third-party developers and made available for informational and technical access purposes only. cTrader Store is not a broker and does not provide investment advice, personal recommendations or any guarantee of future performance.






















Price
Since 30/05/2025
42
Sales