

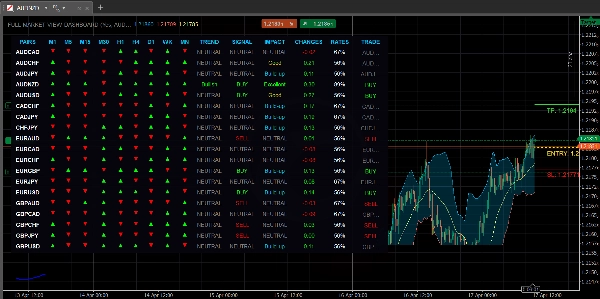

Description
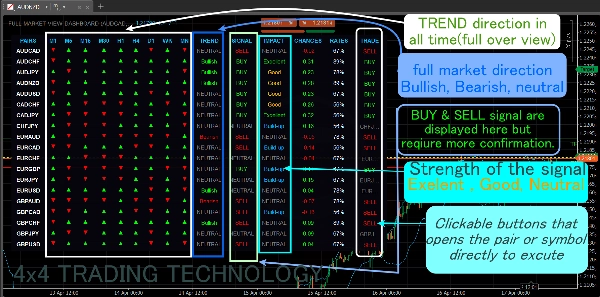
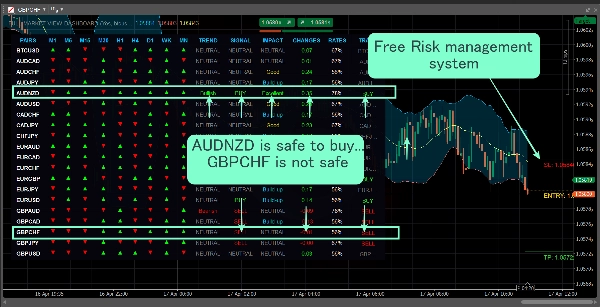
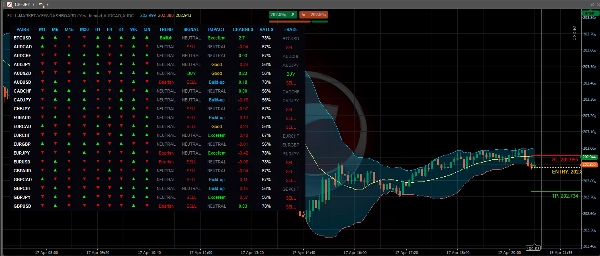
💎 FULL-MARKET-VIEW DASHBOARD: Premium Edition 📈
The Ultimate Multi-Timeframe Scanner & Automated Risk Manager for cTrader.
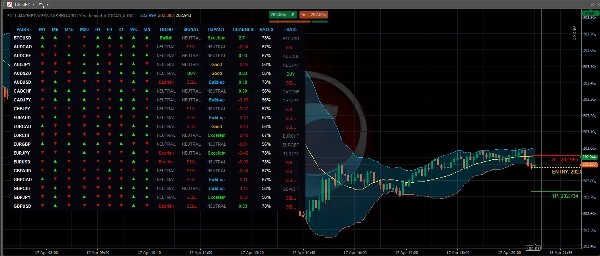
🛑 Stop guessing and start trading with algorithmic precision. The Premium Full-Market-View Dashboard is a complete trading suite that gives you a "bird's-eye view" 🦅 of up to 28 currency pairs, backed by an advanced State-Machine Risk Manager 🧠 that handles your entries, stop losses, and multi-tier take profits completely hands-free. 👐✨
🚀 What's New in the Premium Update?
1. The "Ghost-Line" Multi-Target State Machine 👻🎯 The Risk Manager has been completely overhauled. It no longer just draws static lines—it has memory.
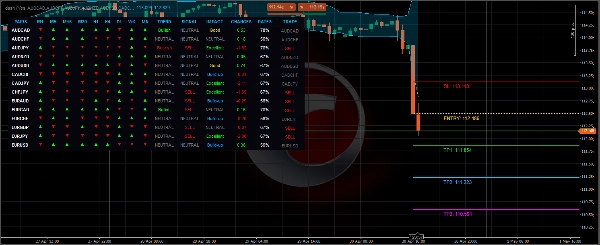
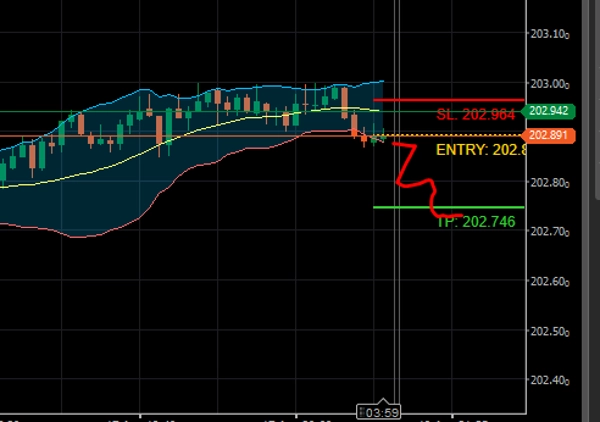
- Multi-TP Scaling ⚖️: The algorithm calculates and locks in TP1, TP2, and TP3 based on precise ATR (Average True Range) volatility measurements. 📏
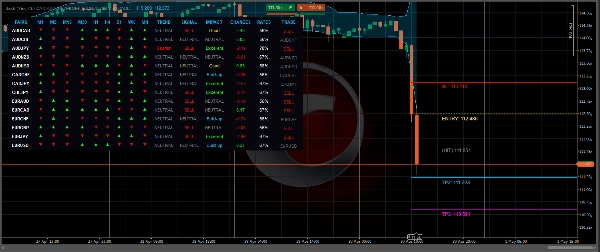
- Visual Archiving 🗂️✅: When the market hits your Take Profit, the solid target line doesn't just disappear. It instantly transforms into a Dotted "Ghost" Line labeled
(HIT), leaving a permanent visual record of your successful trades on the chart. 🏆 - Clean Chart Auto-Wipe 🧹✨: Once your Stop Loss is hit, or all Take Profits are filled, the system clears the remaining active lines, completely freeing up your chart for the next major setup.
2. Institutional "Reversal Override" Logic 🔄🛡️ The market changes fast, and your indicator should too. ⚡ If you are in an active "BUY" setup, but the market suddenly shifts and generates a mathematically valid "SELL" signal, the algorithm instantly triggers a Reversal Override. It will immediately wipe the old failing setup and draw your new Short targets, ensuring you are never trapped on the wrong side of the market. 📉🏃♂️
3. Crash-Proof Symbol Detection 🛡️🔌 Brokers use different names for pairs (e.g., EURUSD.c, EURUSD_raw). The Premium Dashboard features a dynamic "Safety Net" 🕸️ that scans your specific broker's data feed. If a symbol is missing or typed incorrectly, the dashboard will gracefully skip it instead of crashing, automatically falling back to display the symbol of your current active chart. 🧠✅
📊 Core Dashboard Features:
- The "Rule of 7" Multi-Timeframe Consensus 🎯: Scans 9 different timeframes (M1 to Monthly) simultaneously. If 7 or more timeframes align, it highlights a high-probability Bullish 🟢 or Bearish 🔴 macro trend.
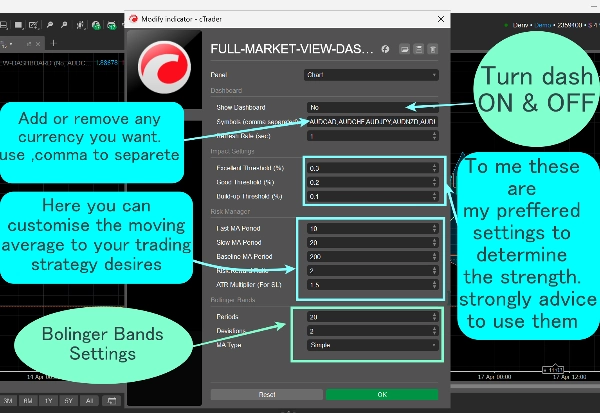
- 200 EMA Baseline Filter 🌊🚦: The built-in Fast/Slow moving average crossover only fires signals if the price is safely trading with the macro 200 EMA trend, protecting you from fake-outs. 🛡️
- Real-Time Momentum Impact 🏎️💨: Automatically calculates daily percentage changes, classifying market movement as Excellent, Good, or Build-up so you know exactly how much gas is left in the tank. ⛽
- One-Click Chart Switching 🖱️⚡: Click any currency pair directly inside the dashboard to instantly change your active chart and jump right into the action.
⚙️ How It Works In Real-Time:
- Scan 🔍: Look at the Dashboard to find pairs with an 80-100% Win Rate and a solid "Bullish" or "Bearish" trend.
- Click 🎯: Click the "BUY" or "SELL" button on the dashboard to instantly open that chart.
- Execute 🤖: Wait for the Fast/Slow MA to cross. The moment the candle closes, the algorithm will lock in your Entry, Stop Loss, and up to three Take Profits on the screen.
- Manage 🍿💰: Sit back and watch the market hit your targets one by one as they turn into dotted
(HIT)lines! 🥂💸
Summary
Key features include an advanced State-Machine Risk Manager that automates trade management by setting entries, stop losses, and up to three take profit levels based on ATR volatility. The risk manager visually archives hit targets with dotted "ghost" lines and automatically clears charts after stop loss or full take profit execution. It also incorporates an institutional-grade "Reversal Override" logic to switch trade direction instantly when market conditions change.
The dashboard supports crash-proof symbol detection, adapting to broker-specific pair naming conventions to maintain stability. Real-time momentum impact is calculated to classify market movement strength. Users can switch charts instantly by clicking pairs within the dashboard, streamlining trade execution.
This indicator outputs signals related to crossovers, trend strength, level touches, breakouts, and session open ranges, relying on tick data for real-time analysis. It is categorized under statistics indicators and risk management tools.
Discussion
Customer reviews
5 | 100 % | |
4 | 0 % | |
3 | 0 % | |
2 | 0 % | |
1 | 0 % |
FAQ
More from this author


























Price